Fig. 8
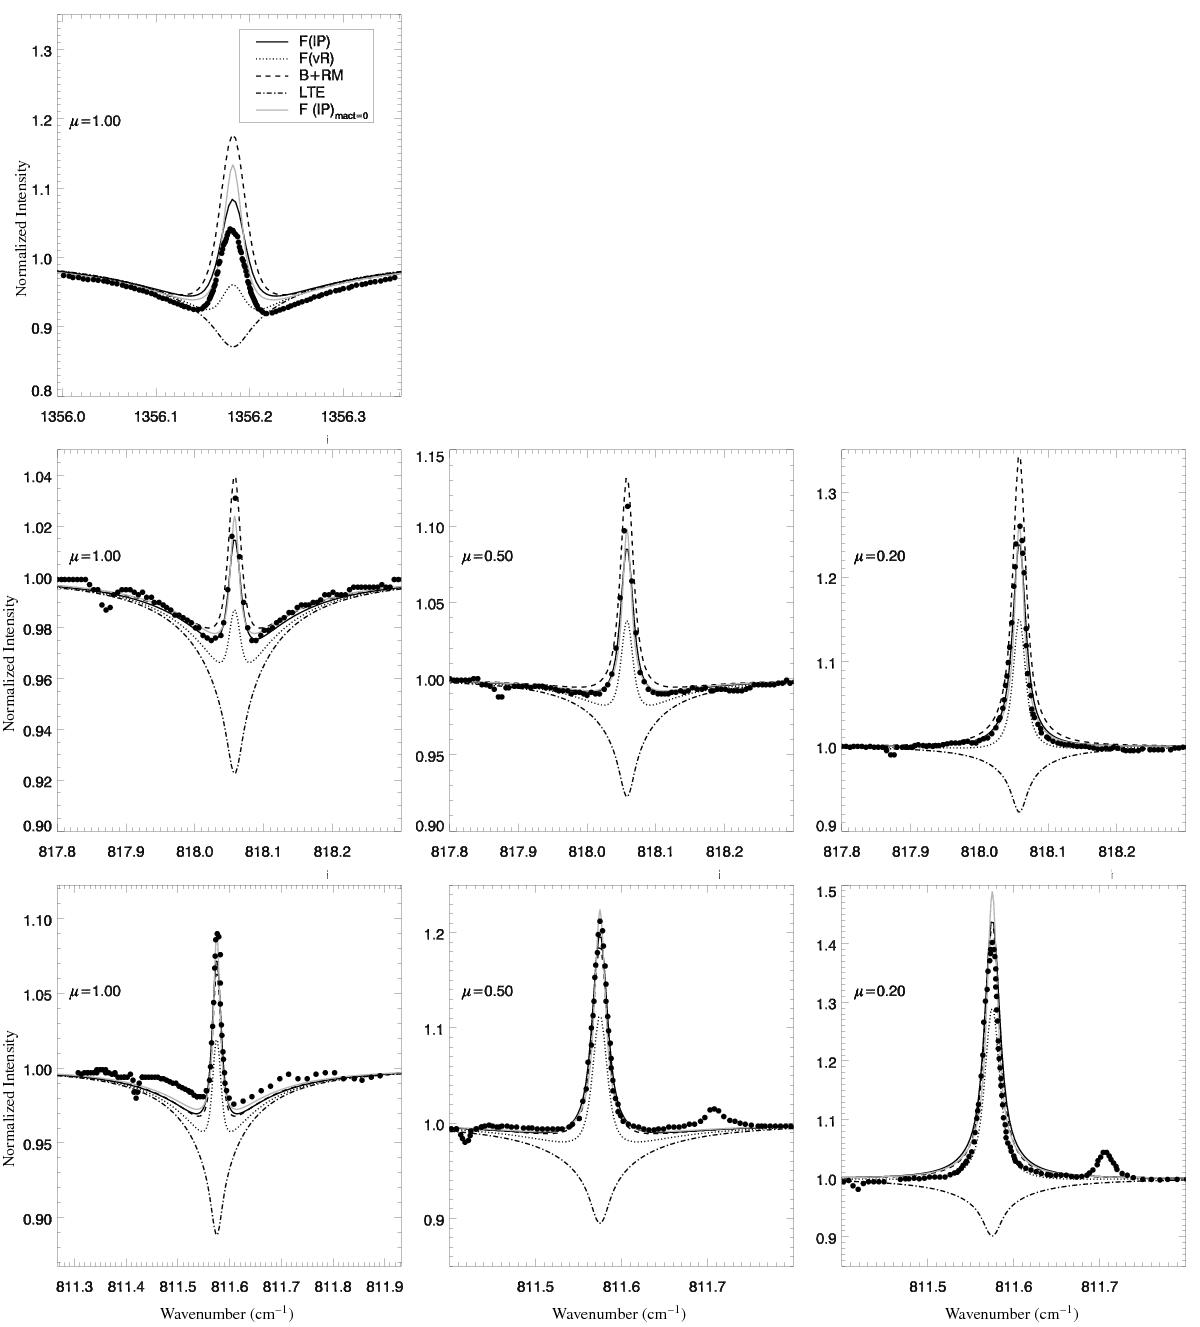
Solar IR line profiles at various positions on the disk. First row: 7.3 μm line, second row: 12.2 μm line, and final row: 12.3 μm line. The columns are μ = 1.0, 0.5, and 0.2, in that order. The circles are observations taken from Chang et al. (1991) for the 7.3 μm line and from Brault & Noyes (1983) for the two 12 μm lines. The synthetic spectral lines are calculated for various model atoms using A(Mg ) = 7.6 and employing the ⟨3D⟩ 1D solar model atmosphere. For the synthetic profiles, a macroturbulent velocity of 3.15 km s-1 and a rotational broadening of vsini = 1.6 km s-1 are used. For model F, the profile without macroturbulence is also shown (grey full line) to demonstrate its effect.
Current usage metrics show cumulative count of Article Views (full-text article views including HTML views, PDF and ePub downloads, according to the available data) and Abstracts Views on Vision4Press platform.
Data correspond to usage on the plateform after 2015. The current usage metrics is available 48-96 hours after online publication and is updated daily on week days.
Initial download of the metrics may take a while.