Fig. 7
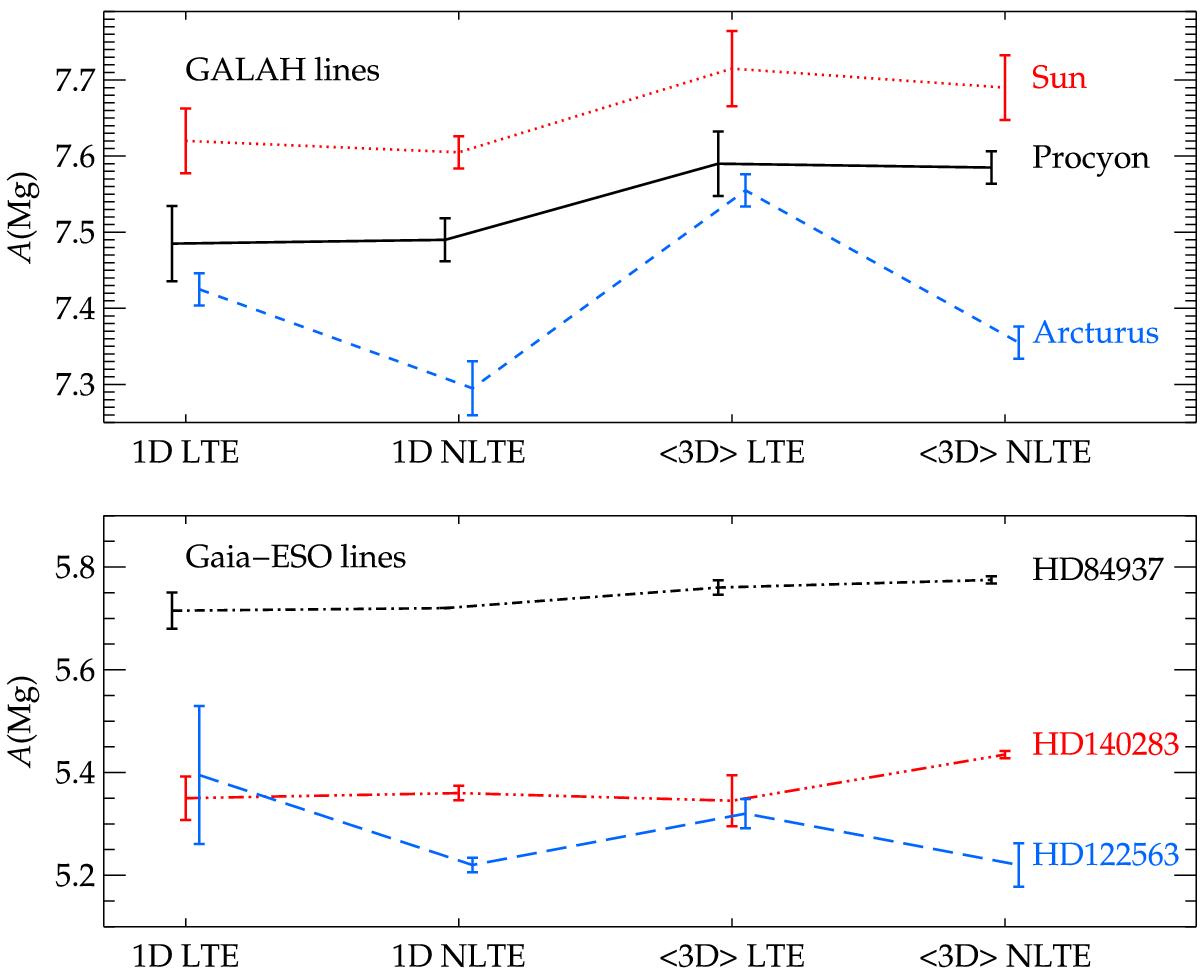
Top panel: Mg abundances of stars in the solar neighbourhood affected by different types of modelling. The spectral lines used are those covered by the GALAH survey: 5711 Å and 7691 Å. Bottom panel: same for metal-poor halo stars, based on lines observed in the Gaia-ESO survey: 5528 Å and 8806 Å.
Current usage metrics show cumulative count of Article Views (full-text article views including HTML views, PDF and ePub downloads, according to the available data) and Abstracts Views on Vision4Press platform.
Data correspond to usage on the plateform after 2015. The current usage metrics is available 48-96 hours after online publication and is updated daily on week days.
Initial download of the metrics may take a while.