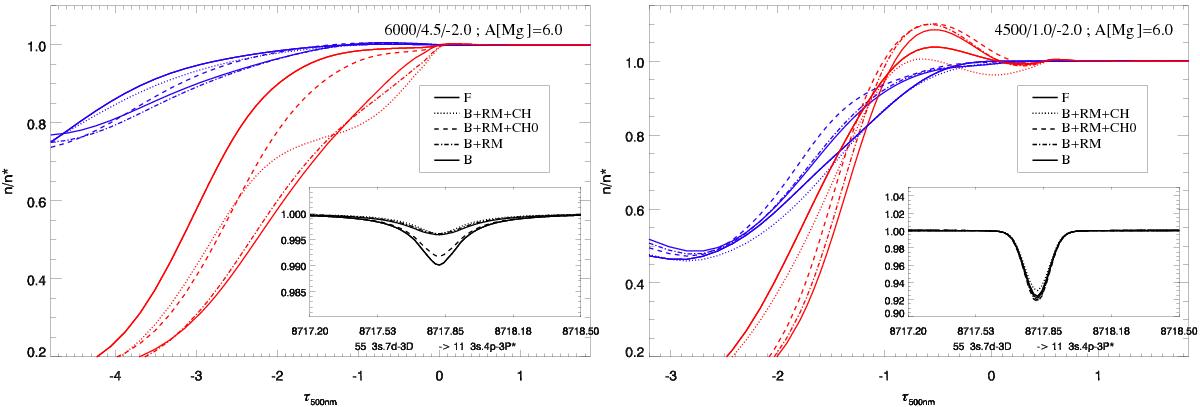
Fig. 11

Departure coefficients b = n/nLTE of the levels involved in the 8718 Å line, 7d (blue) and 4p (red). Left panel: metal-poor dwarf case, right panel: metal-poor giant case. The insets show the corresponding line profiles. Note that in the giant case, abundance corrections corresponding to some models for which b are shown here are not shown in Fig. 10 because the models did not converge for at least three abundance values.
Current usage metrics show cumulative count of Article Views (full-text article views including HTML views, PDF and ePub downloads, according to the available data) and Abstracts Views on Vision4Press platform.
Data correspond to usage on the plateform after 2015. The current usage metrics is available 48-96 hours after online publication and is updated daily on week days.
Initial download of the metrics may take a while.


