Free Access
Fig. 5
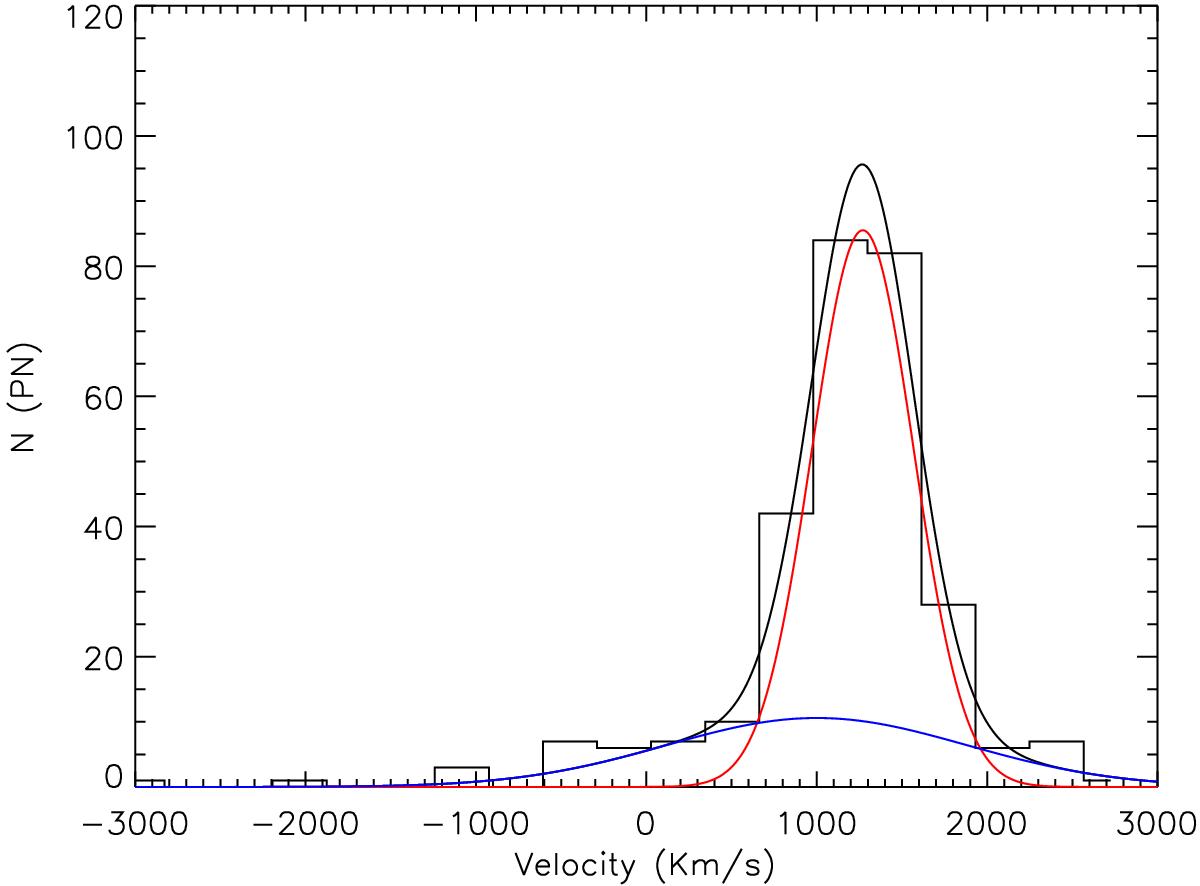
Histogram of the line-of-sight velocities of the spectroscopically confirmed PNs (black histogram) fitted with a double Gaussian (black curve). Red and blue lines represent the two Gaussians associated with the M 87 halo and the IC components.
Current usage metrics show cumulative count of Article Views (full-text article views including HTML views, PDF and ePub downloads, according to the available data) and Abstracts Views on Vision4Press platform.
Data correspond to usage on the plateform after 2015. The current usage metrics is available 48-96 hours after online publication and is updated daily on week days.
Initial download of the metrics may take a while.