Free Access
Fig. 3
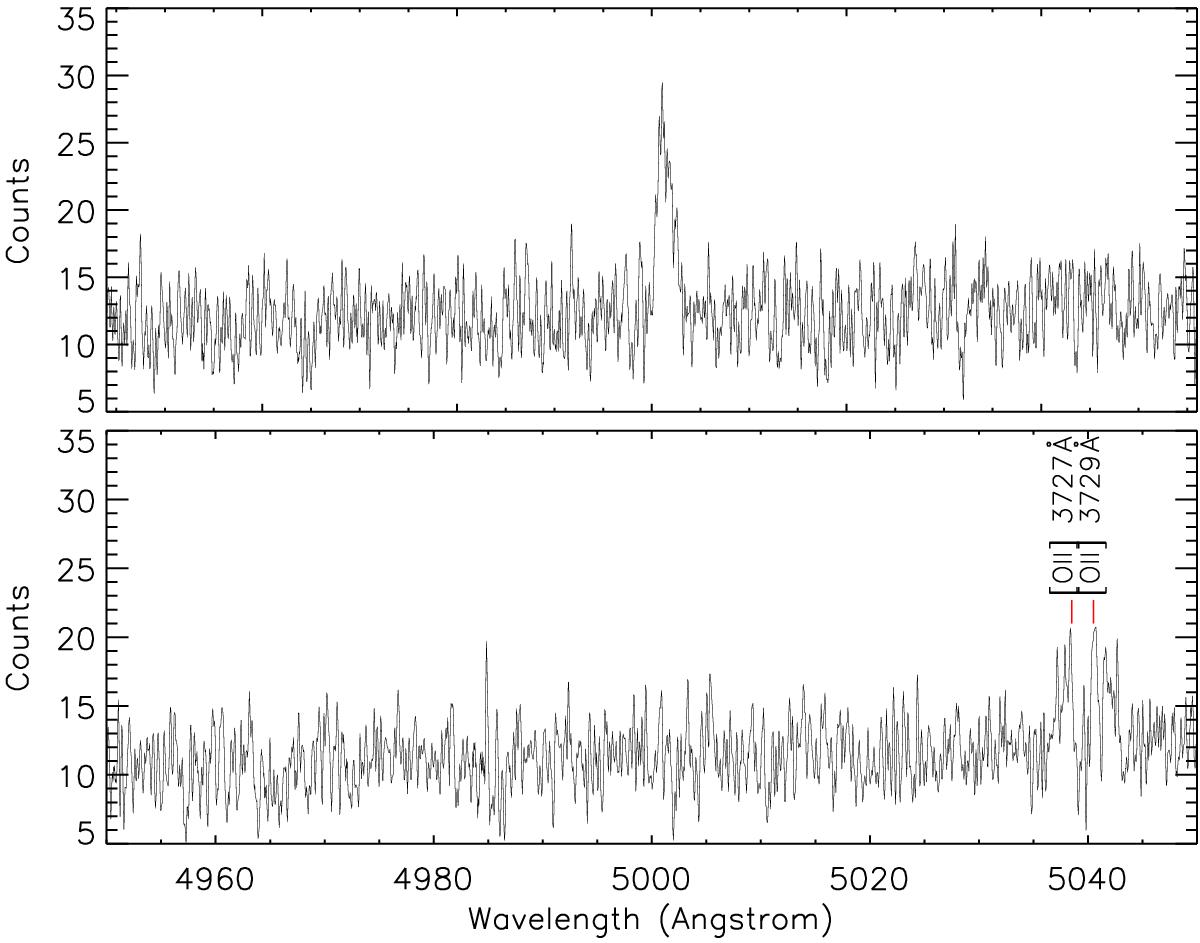
Spectra for background emission line galaxies: Lyα emitter at z ~ 3.1 (top panel) and [OII] emitter at z ~ 0.34 (bottom panel). Red vertical lines mark the positions of the two components of the λ3726+3729 Å emission. We smoothed the spectra to 0.015 nm per pixel.
Current usage metrics show cumulative count of Article Views (full-text article views including HTML views, PDF and ePub downloads, according to the available data) and Abstracts Views on Vision4Press platform.
Data correspond to usage on the plateform after 2015. The current usage metrics is available 48-96 hours after online publication and is updated daily on week days.
Initial download of the metrics may take a while.