Fig. 10
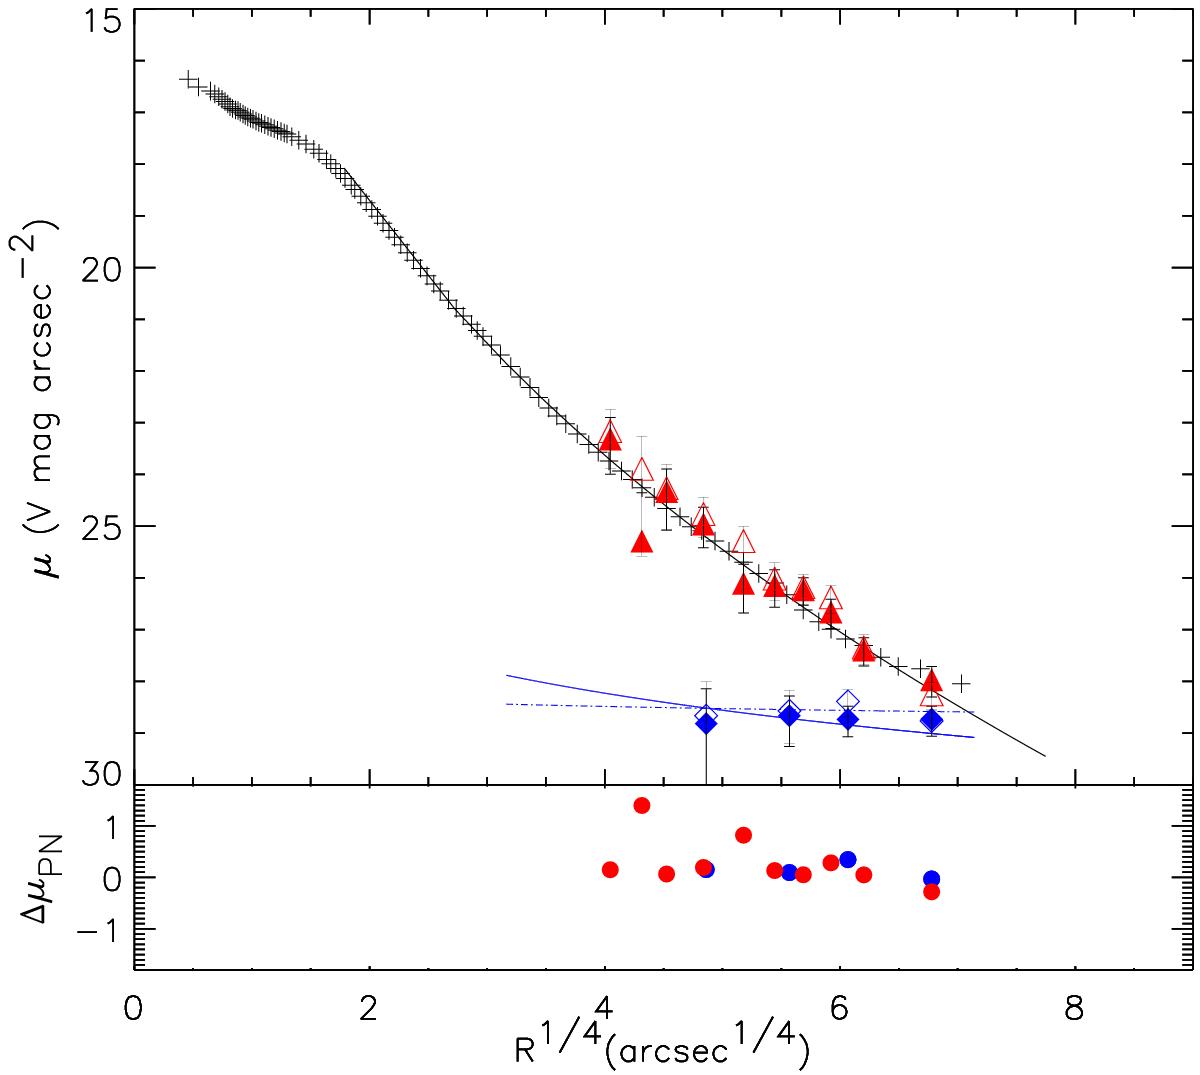
Top panel: same as in Fig. 9, but here the halo and IC number density profiles are computed separately for the NW (filled symbols) and SE (open symbols) sides of M 87. Bottom panel: difference between the logarithmic PN number density profiles of the halo (red dots) and IC (blue dots) PNs in the NW and SE M 87 regions. A value of zero indicates no difference in the number of sources on opposite sides at a given major axis distance.
Current usage metrics show cumulative count of Article Views (full-text article views including HTML views, PDF and ePub downloads, according to the available data) and Abstracts Views on Vision4Press platform.
Data correspond to usage on the plateform after 2015. The current usage metrics is available 48-96 hours after online publication and is updated daily on week days.
Initial download of the metrics may take a while.