Fig. 7
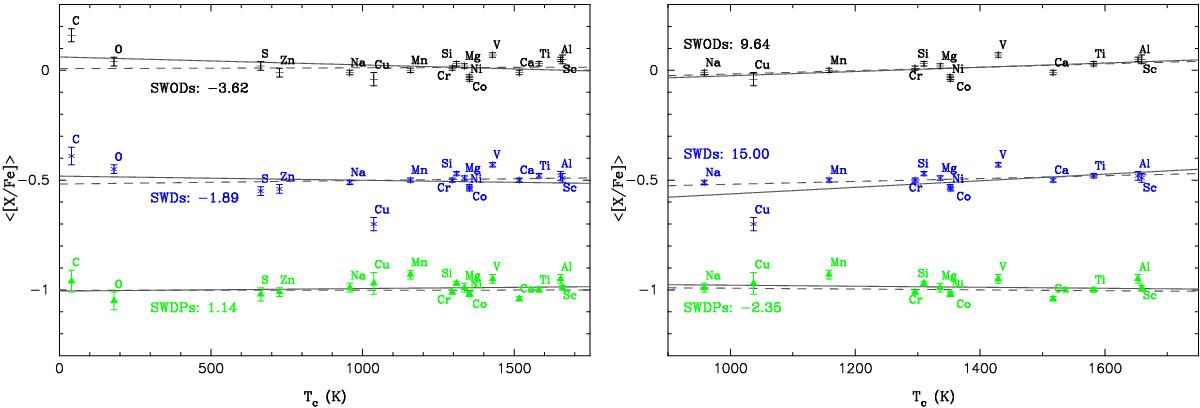
⟨[ X/Fe ] ⟩ − TC trends for the SWOD, SWD, and SWDP samples when all elements (volatiles and refractories) are taken into account (left) and when only refractories are considered (right). For the sake of clarity, an offset of −0.50 dex was applied between the samples. Unweighted fits are shown by continuous lines, while weighted fits are plotted in dashed lines. For guidance, the derived slopes from the unweighted fits are shown in the plots (units of 10-5 dex/K).
Current usage metrics show cumulative count of Article Views (full-text article views including HTML views, PDF and ePub downloads, according to the available data) and Abstracts Views on Vision4Press platform.
Data correspond to usage on the plateform after 2015. The current usage metrics is available 48-96 hours after online publication and is updated daily on week days.
Initial download of the metrics may take a while.