Fig. 13

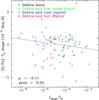
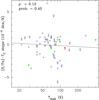
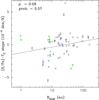
![]() -slope as a function of the dust parameters, fractional dust luminosity Ldust/L⋆ (left panel), dust temperature Tdust (middle panel), and disc radius Rdisc. A linear fit to the data is shown by the grey continuous line. Results from the Spearman’s correlation test are also shown in the plot (lower/upper limits are not considered in the statistics).
-slope as a function of the dust parameters, fractional dust luminosity Ldust/L⋆ (left panel), dust temperature Tdust (middle panel), and disc radius Rdisc. A linear fit to the data is shown by the grey continuous line. Results from the Spearman’s correlation test are also shown in the plot (lower/upper limits are not considered in the statistics).
Current usage metrics show cumulative count of Article Views (full-text article views including HTML views, PDF and ePub downloads, according to the available data) and Abstracts Views on Vision4Press platform.
Data correspond to usage on the plateform after 2015. The current usage metrics is available 48-96 hours after online publication and is updated daily on week days.
Initial download of the metrics may take a while.