Fig. 4
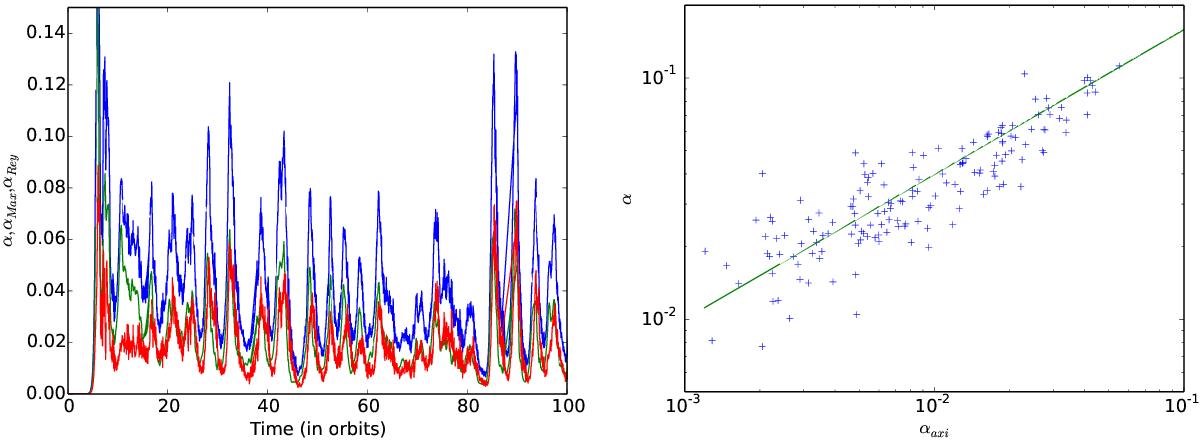
Left panel: time history of α (blue curve), αMax (red curve), and αRey (green curve) in model Z-C-Re3000. Right panel: scatter plot showing the total angular momentum transport rate α as a function of αaxi which measures the angular momentum transport due to ![]() and
and ![]() modes for 120 dumps evenly spaced over model Z-C-Re3000. The green curve plots an approximate fit to the data (see text for details).
modes for 120 dumps evenly spaced over model Z-C-Re3000. The green curve plots an approximate fit to the data (see text for details).
Current usage metrics show cumulative count of Article Views (full-text article views including HTML views, PDF and ePub downloads, according to the available data) and Abstracts Views on Vision4Press platform.
Data correspond to usage on the plateform after 2015. The current usage metrics is available 48-96 hours after online publication and is updated daily on week days.
Initial download of the metrics may take a while.