Fig. 8
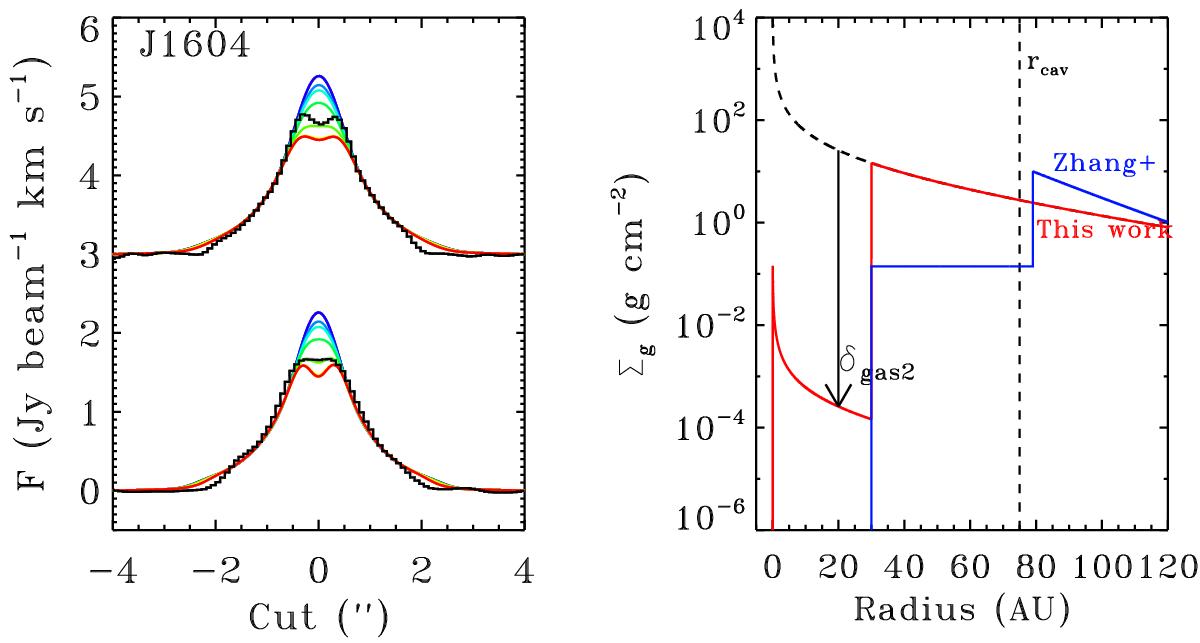
Left: modeling results and observations of the 12CO emission for the best-fitting physical gas model for J1604-2130 for the inner 30 AU cavity comparing δgas2 (gas density drop inside the 30 AU dust cavity). δgas2 is varied as 100, 10-1, ..., 10-6 as blue, light blue, cyan, green, yellow, orange, and red (δgas is taken as 1). The observations are plotted in black. The panel shows the intensity cuts through the major (bottom) and minor (top) axis of the 12CO zero-moment map. Right: comparison between the density profile derived in this study and the profile used in Zhang et al. (2014).
Current usage metrics show cumulative count of Article Views (full-text article views including HTML views, PDF and ePub downloads, according to the available data) and Abstracts Views on Vision4Press platform.
Data correspond to usage on the plateform after 2015. The current usage metrics is available 48-96 hours after online publication and is updated daily on week days.
Initial download of the metrics may take a while.