Fig. 7
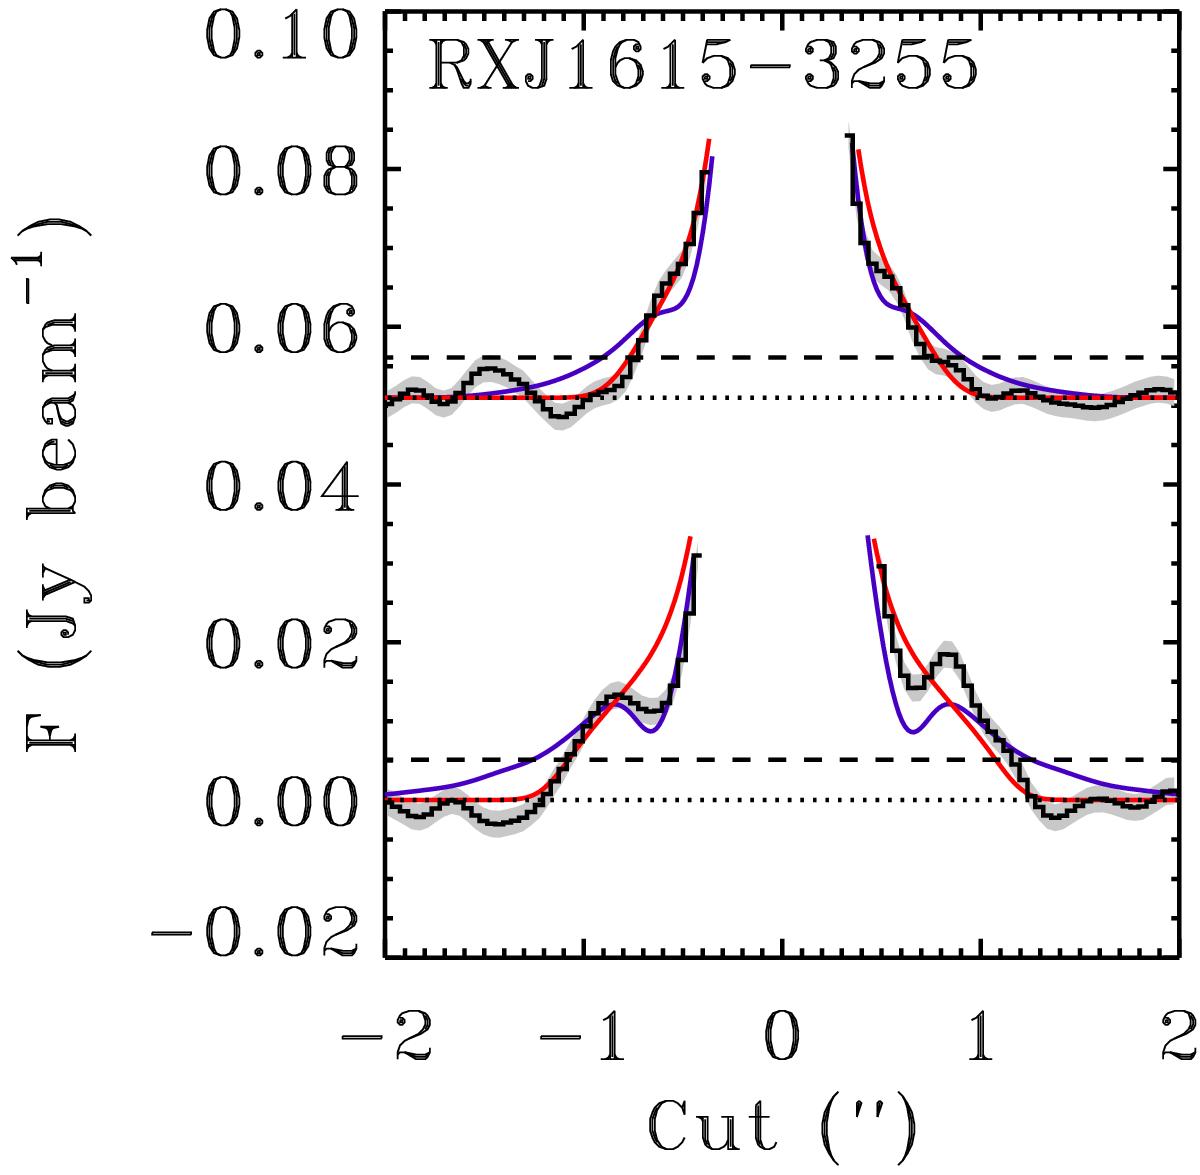
Modeling results and observations of the 690 GHz continuum of RX J1615-3255. The panel shows the intensity cuts through the major (bottom) and minor (top) axis of the continuum image, zoomed in on the lowest flux levels (<20σ). The observations are plotted in black with the 1σ errors in gray. In red and blue we present the models with and without a dust gap between 110 and 130 AU. The dotted and dashed lines indicate the zero flux and 3σ limits, respectively.
Current usage metrics show cumulative count of Article Views (full-text article views including HTML views, PDF and ePub downloads, according to the available data) and Abstracts Views on Vision4Press platform.
Data correspond to usage on the plateform after 2015. The current usage metrics is available 48-96 hours after online publication and is updated daily on week days.
Initial download of the metrics may take a while.