Fig. 5
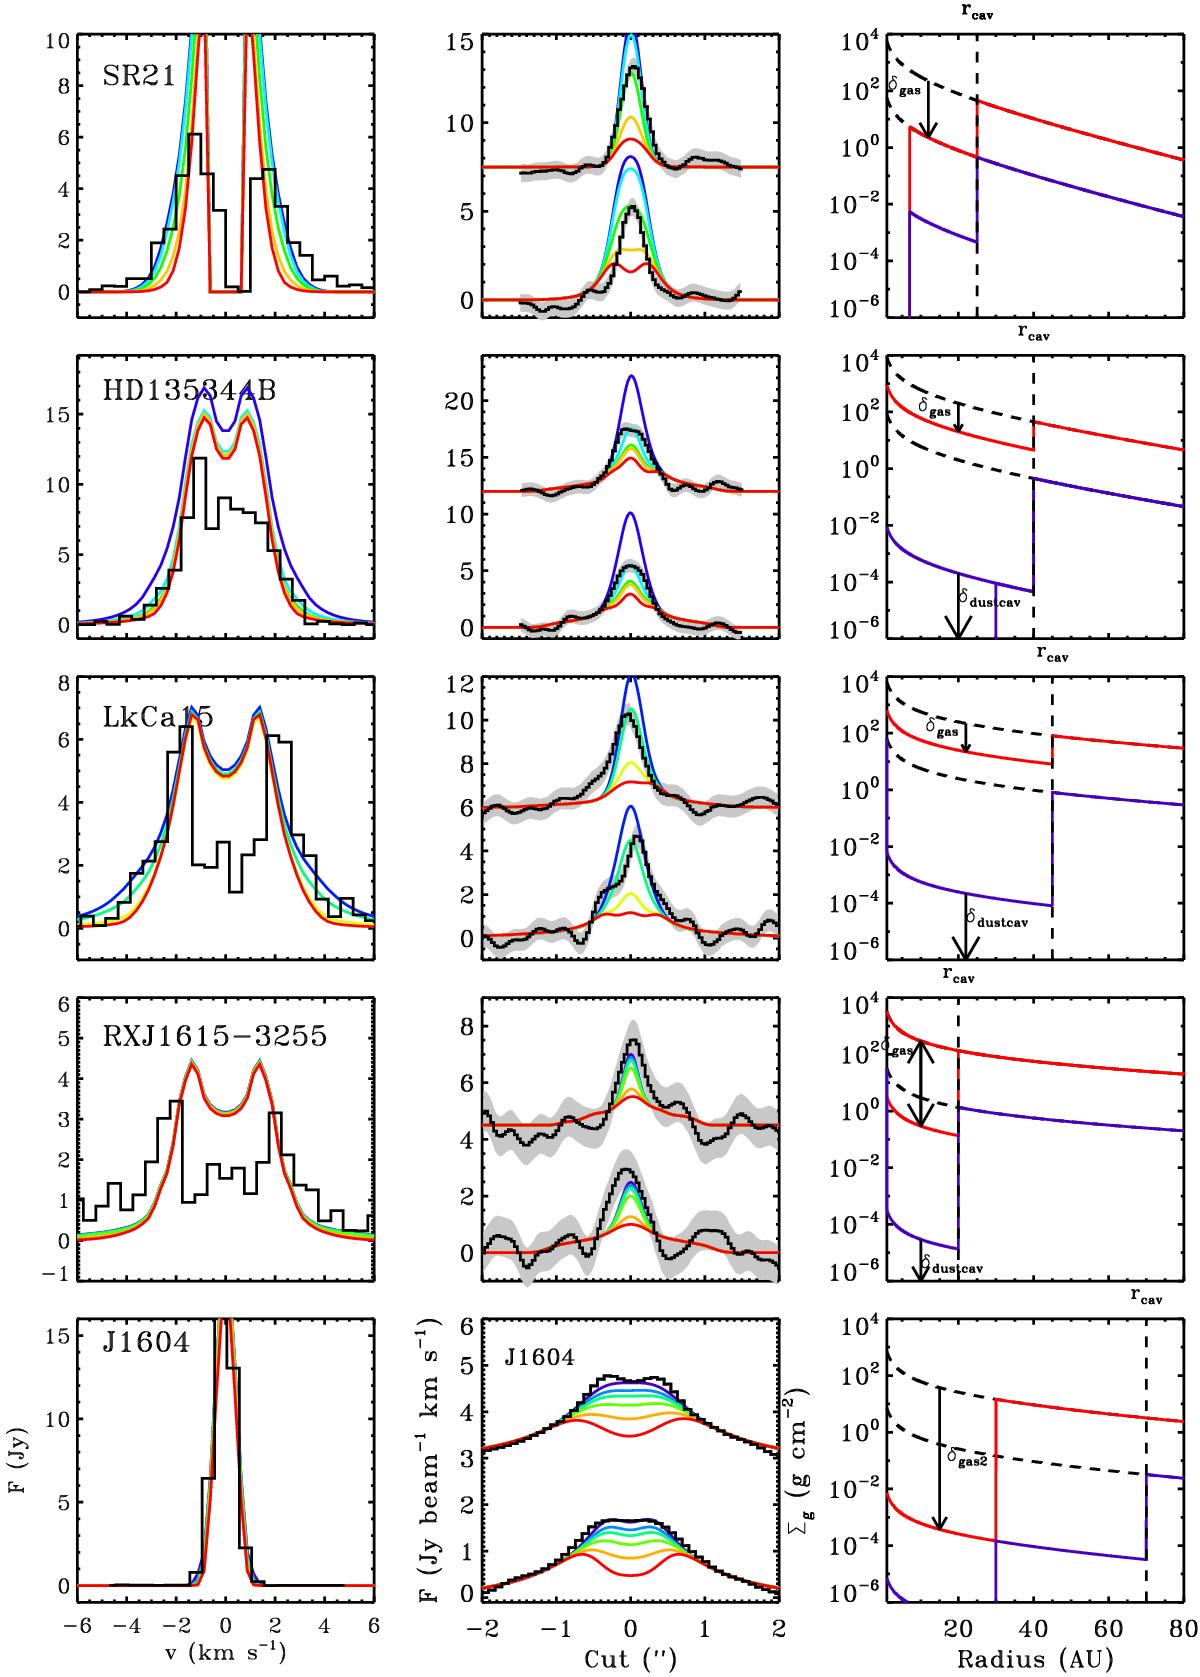
Modeling results and observations of the 12CO emission for the best-fitting physical model for gas and dust (Fig. 4) comparing δgas (gas density drop inside the dust cavity). δgas is varied as 100, 10-1, ..., 10-4 as blue, light blue, green, yellow, and red in the left and middle plots, while the observational data are plotted in black. Left: the 12CO spectrum integrated over the disk area. Middle: the intensity cuts through the major (bottom) and minor (top) axis of the 12CO zero-moment map for different δgas. The noise level is indicated by the gray area. The model images are convolved with the same beam as the ALMA observations. Right: the best-fitting result for possible values of δgas and δdustcav in red and blue.
Current usage metrics show cumulative count of Article Views (full-text article views including HTML views, PDF and ePub downloads, according to the available data) and Abstracts Views on Vision4Press platform.
Data correspond to usage on the plateform after 2015. The current usage metrics is available 48-96 hours after online publication and is updated daily on week days.
Initial download of the metrics may take a while.