Fig. 4
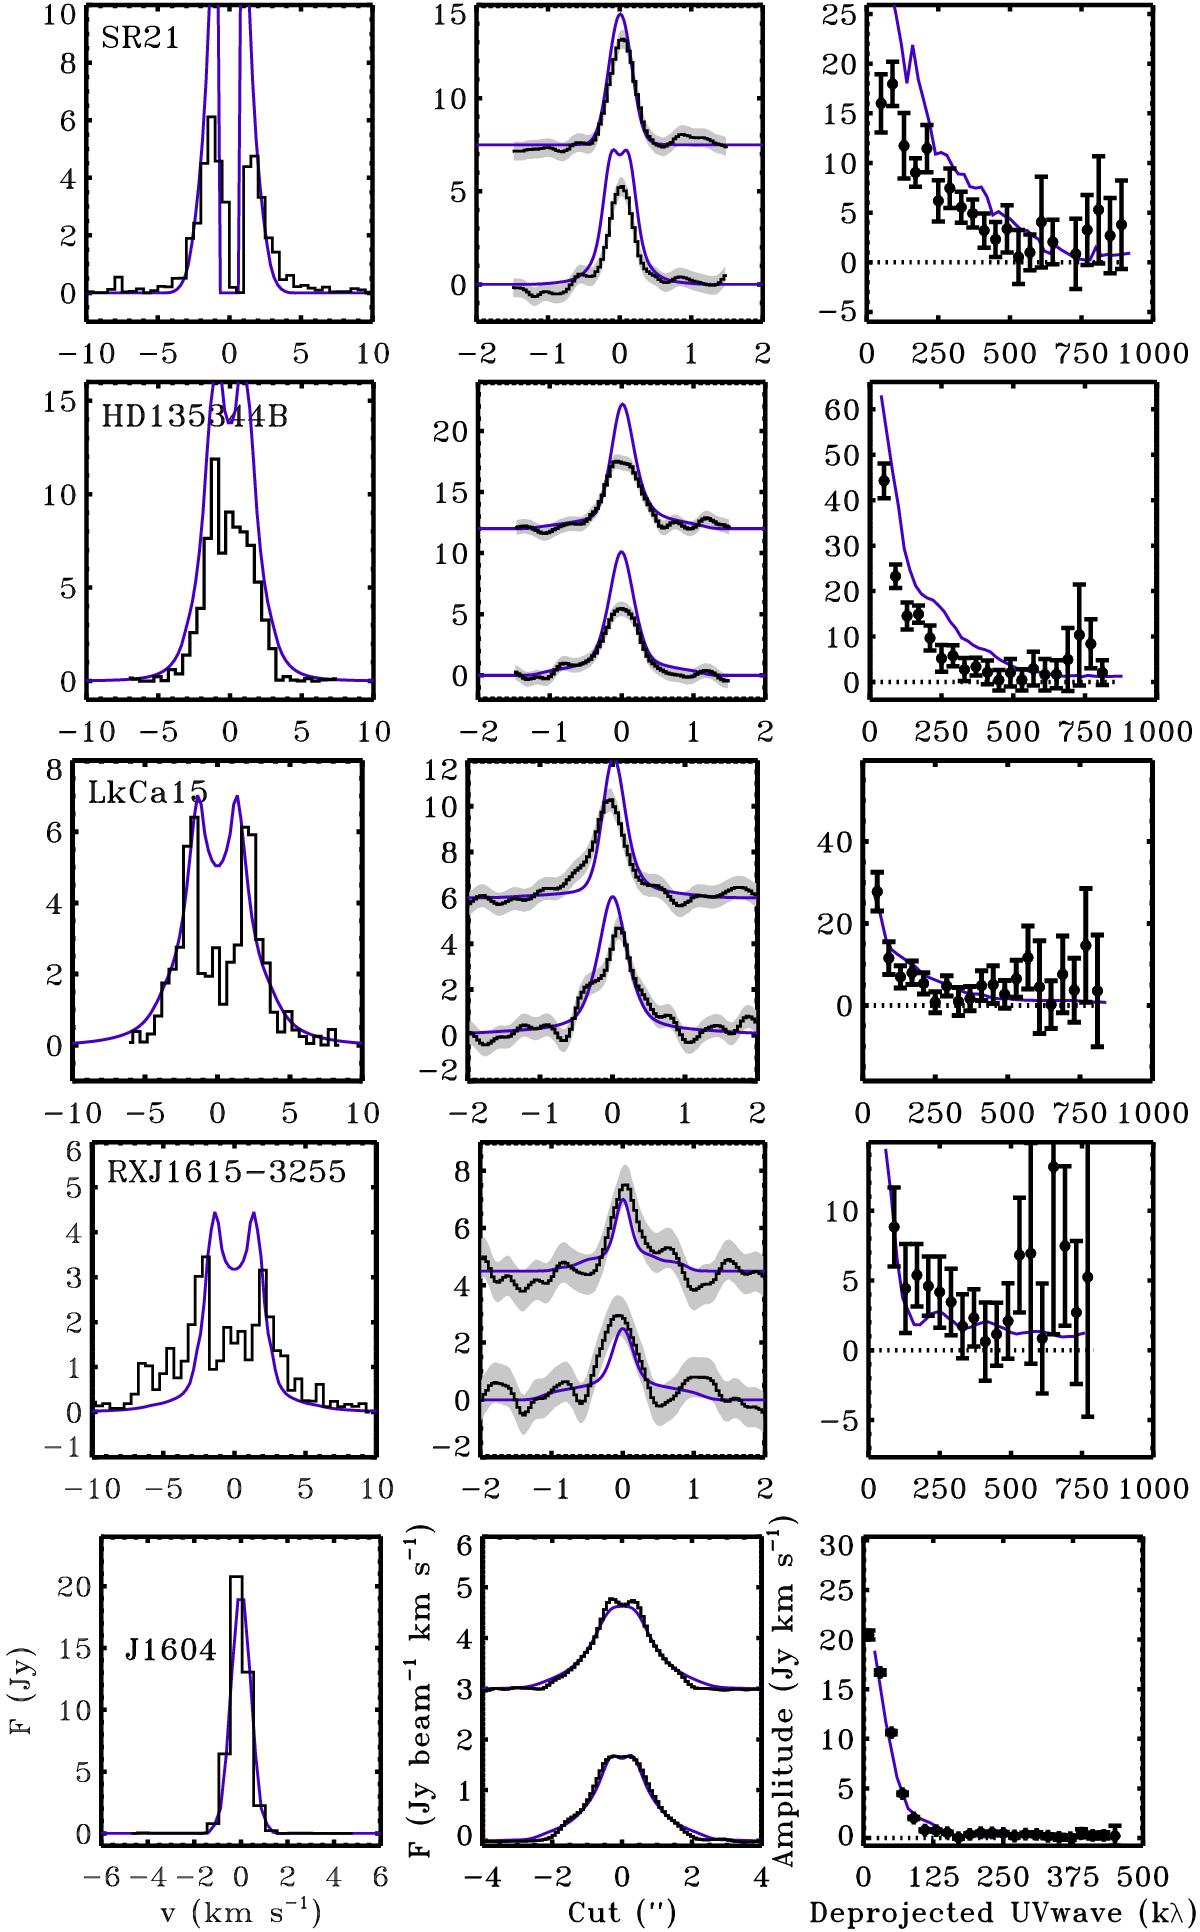
Modeling results and observations of the 12CO emission for the best-fitting physical model derived from the dust (see Fig. 3 and Table 4), with δgas = 1 (no drop in gas surface density inside the cavity). The observations are plotted in black, the models in purple. Left: 12CO spectrum integrated over the entire disk. Center: intensity cuts through the major (bottom) and minor (top) axis of the 12CO zero moment map. The noise level is indicated by the gray zone. The model images are convolved with the same beam as the ALMA observations. Right: amplitude of the integrated 12CO visibility for the deprojected baselines. The null line is indicated with a dashed line, and error bars indicate the noise.
Current usage metrics show cumulative count of Article Views (full-text article views including HTML views, PDF and ePub downloads, according to the available data) and Abstracts Views on Vision4Press platform.
Data correspond to usage on the plateform after 2015. The current usage metrics is available 48-96 hours after online publication and is updated daily on week days.
Initial download of the metrics may take a while.