Fig. 3
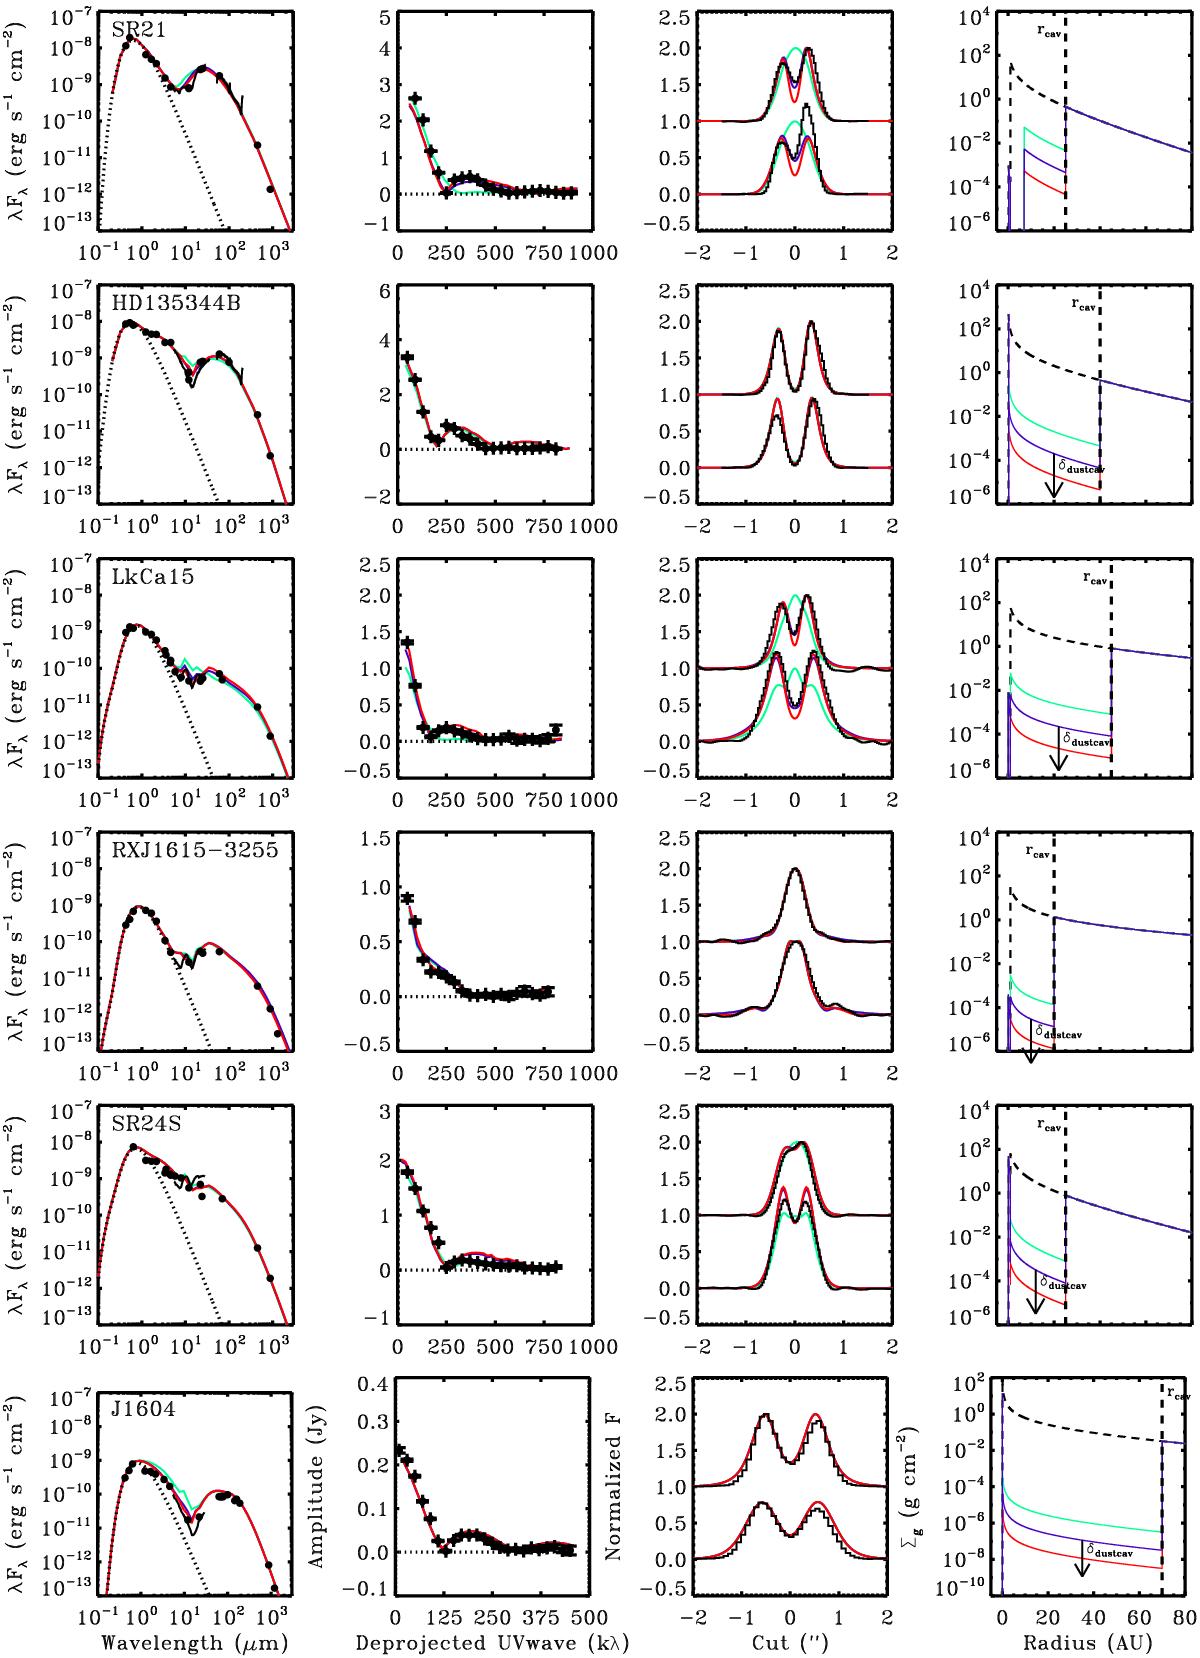
Modeling results and observations of the dust surface density, comparing δdustcav ranging between 10-2 and 10-8 as indicated in the right panel. The observations are plotted in black. Left: spectral energy distribution. Middle left: amplitude of the 690 GHz continuum visibility for the deprojected baselines. The null line is indicated with a dashed line. Middle right: normalized intensity cuts through the major (bottom) and minor (top) axis of the 690 GHz continuum image. The model images are convolved with the same beam as the ALMA observations. Right: dust surface density profile. Indicated are the δdust, the drop in density to fit the inner disk through the near-infrared emission, and δdustcav, the minimum drop in dust density inside the cavity to fit the observations. In SR21 (top panel) the region inside 7 AU is assumed to be empty because of additional constraints (see main text). In all other disks δdustcav is found to be at most 10-4. All other disk parameters are as listed in Table 4.
Current usage metrics show cumulative count of Article Views (full-text article views including HTML views, PDF and ePub downloads, according to the available data) and Abstracts Views on Vision4Press platform.
Data correspond to usage on the plateform after 2015. The current usage metrics is available 48-96 hours after online publication and is updated daily on week days.
Initial download of the metrics may take a while.