Fig. 7
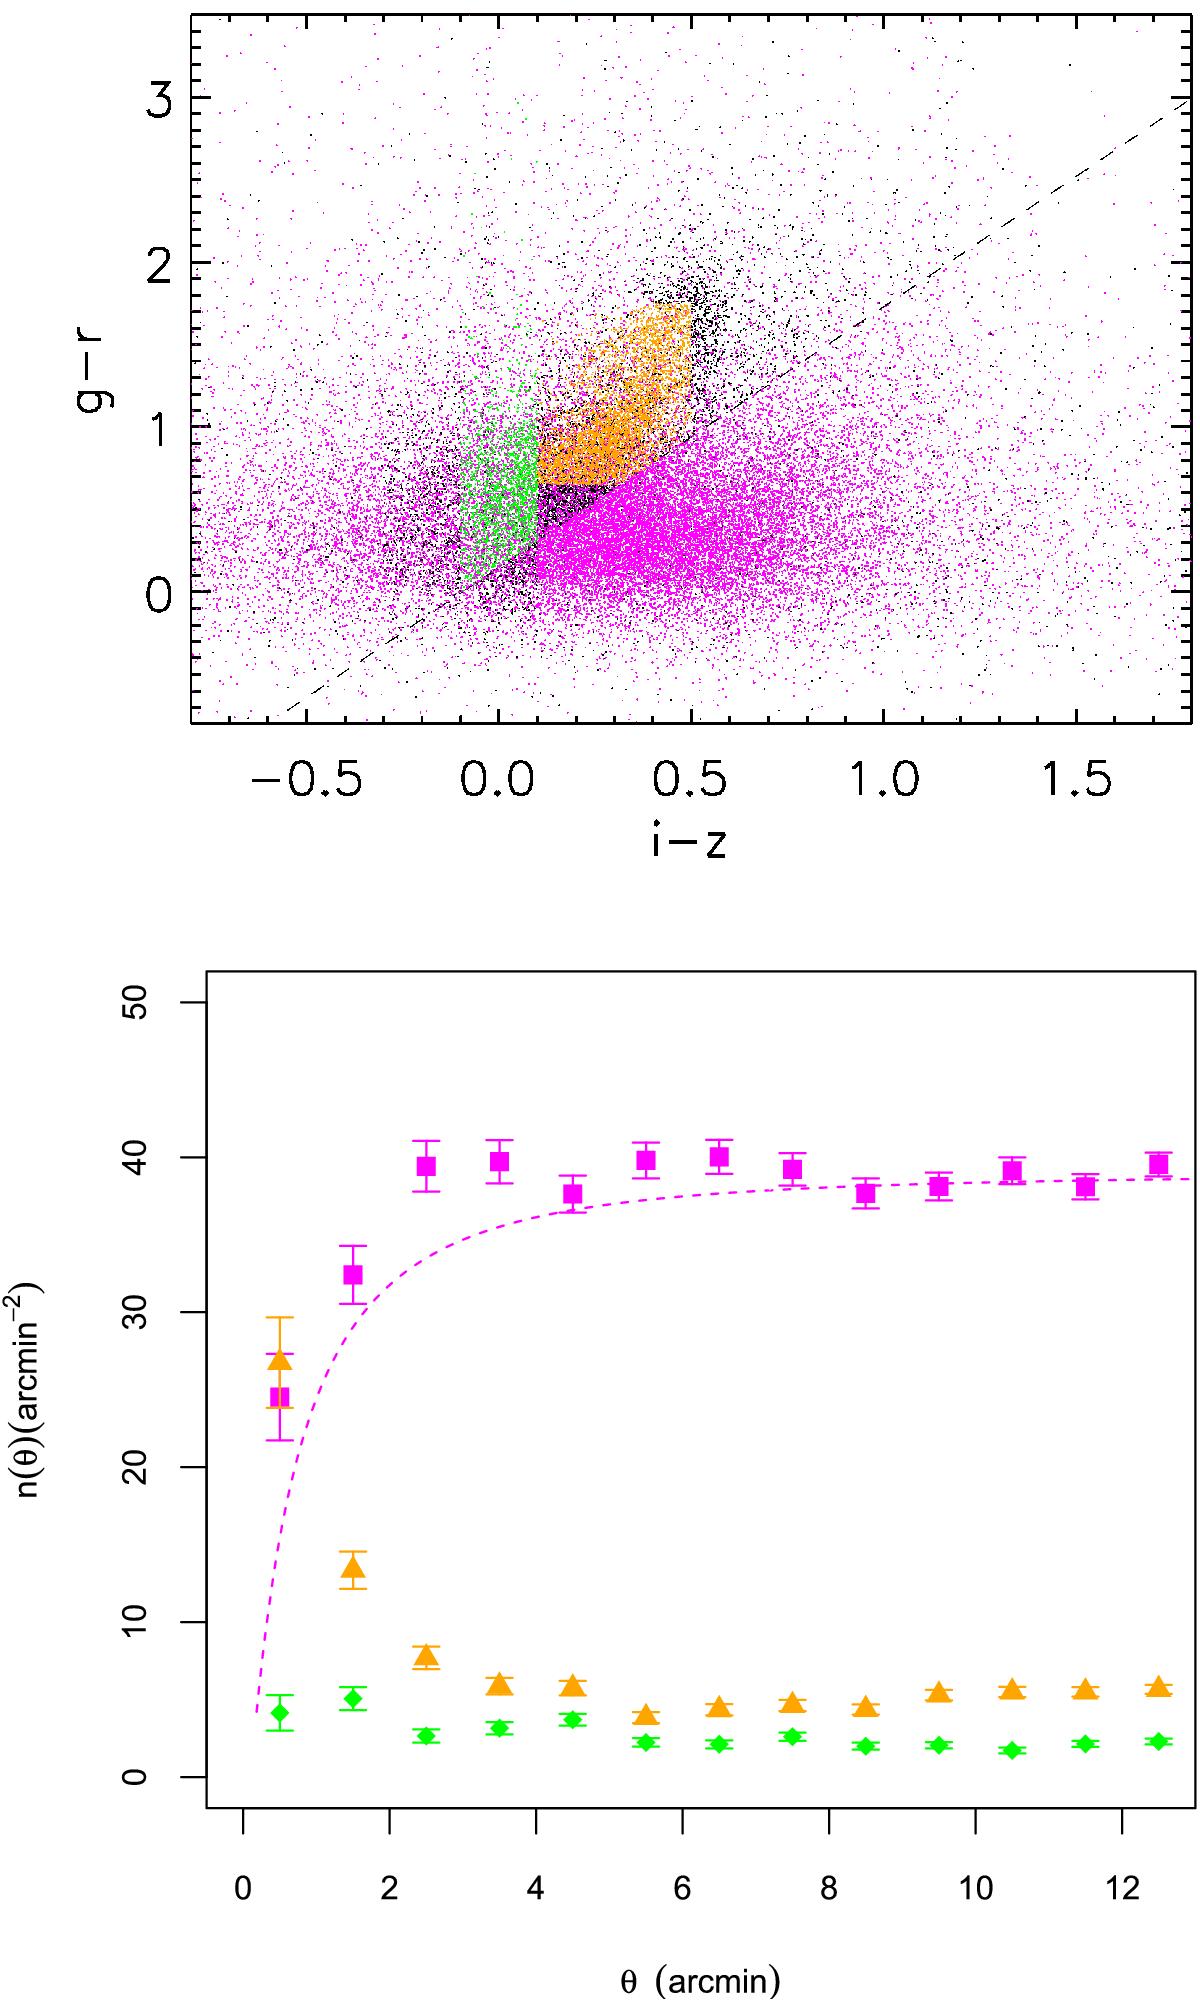
Selection in CC space. Upper panel: CC diagram for PLCK G100 galaxies. Cluster members are shown with orange dots, and foreground and background galaxies with green and magenta dots, respectively. Unclassified sources are plotted with black dots. Bottom panel: radial number density profiles of galaxies. The background density profile (magenta squares) shows a decrease in the central region; overplotted is the magnification effect expected for a NFW profile.
Current usage metrics show cumulative count of Article Views (full-text article views including HTML views, PDF and ePub downloads, according to the available data) and Abstracts Views on Vision4Press platform.
Data correspond to usage on the plateform after 2015. The current usage metrics is available 48-96 hours after online publication and is updated daily on week days.
Initial download of the metrics may take a while.