Fig. 5
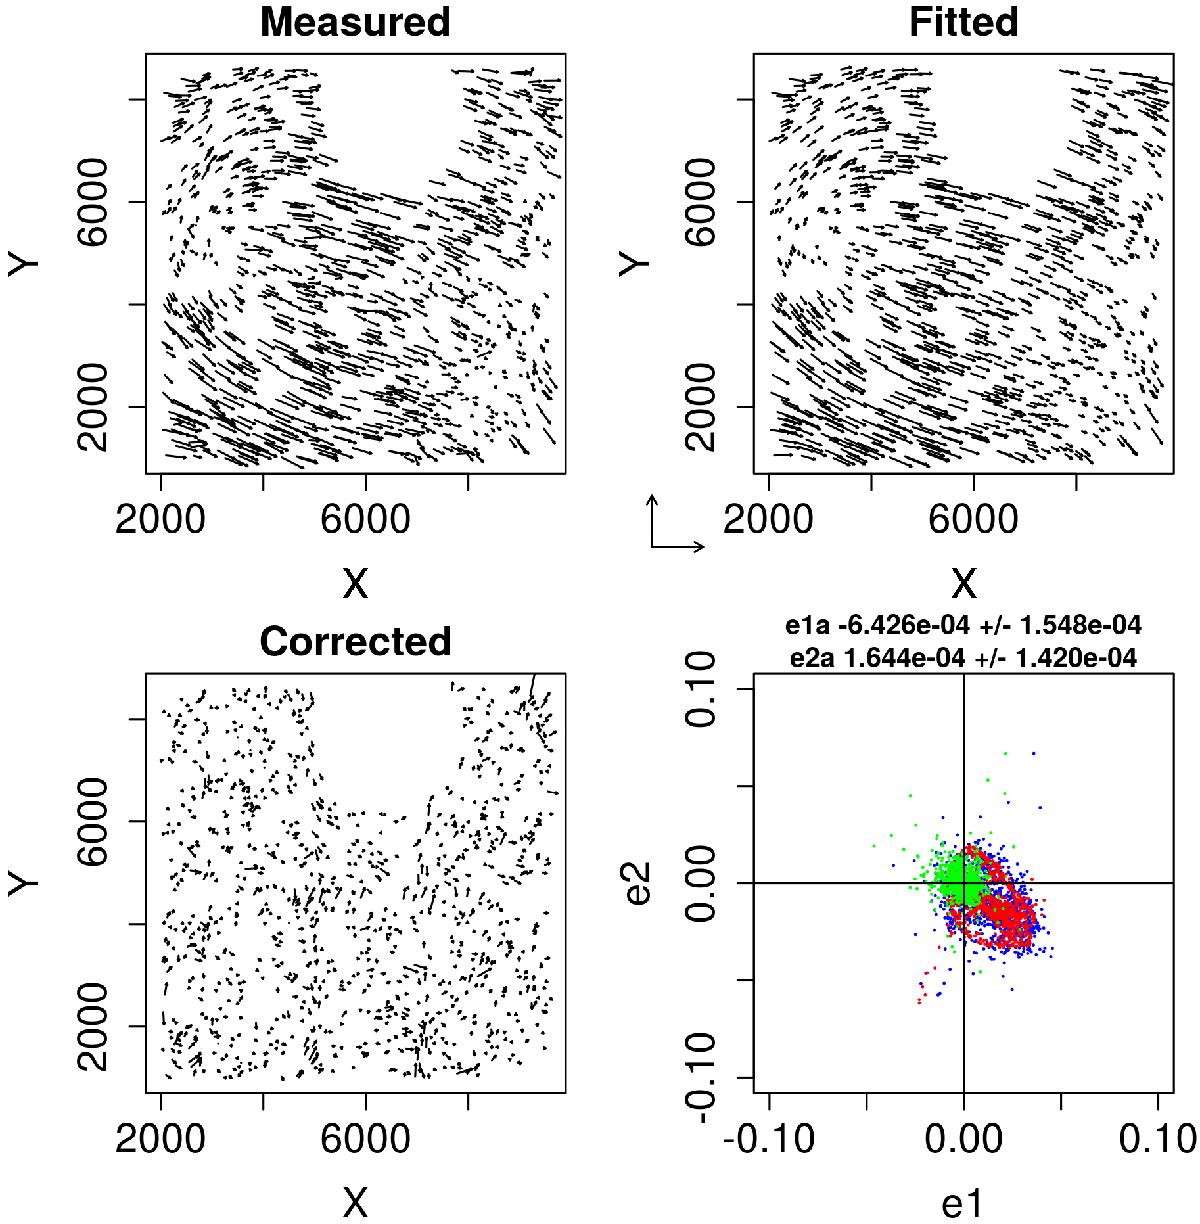
PSF anisotropy correction: the first three panels show the ellipticity pattern (measured, derived from the PSFex model, and corrected (eaniso); X and Y are in pixels). The scale is given by the arrows in the middle (e = 0.1). In the last panel, blue and red dots are the values of eaniso derived from real stars and from the PSFex model, respectively; green dots are the values after the correction.
Current usage metrics show cumulative count of Article Views (full-text article views including HTML views, PDF and ePub downloads, according to the available data) and Abstracts Views on Vision4Press platform.
Data correspond to usage on the plateform after 2015. The current usage metrics is available 48-96 hours after online publication and is updated daily on week days.
Initial download of the metrics may take a while.