Fig. 12
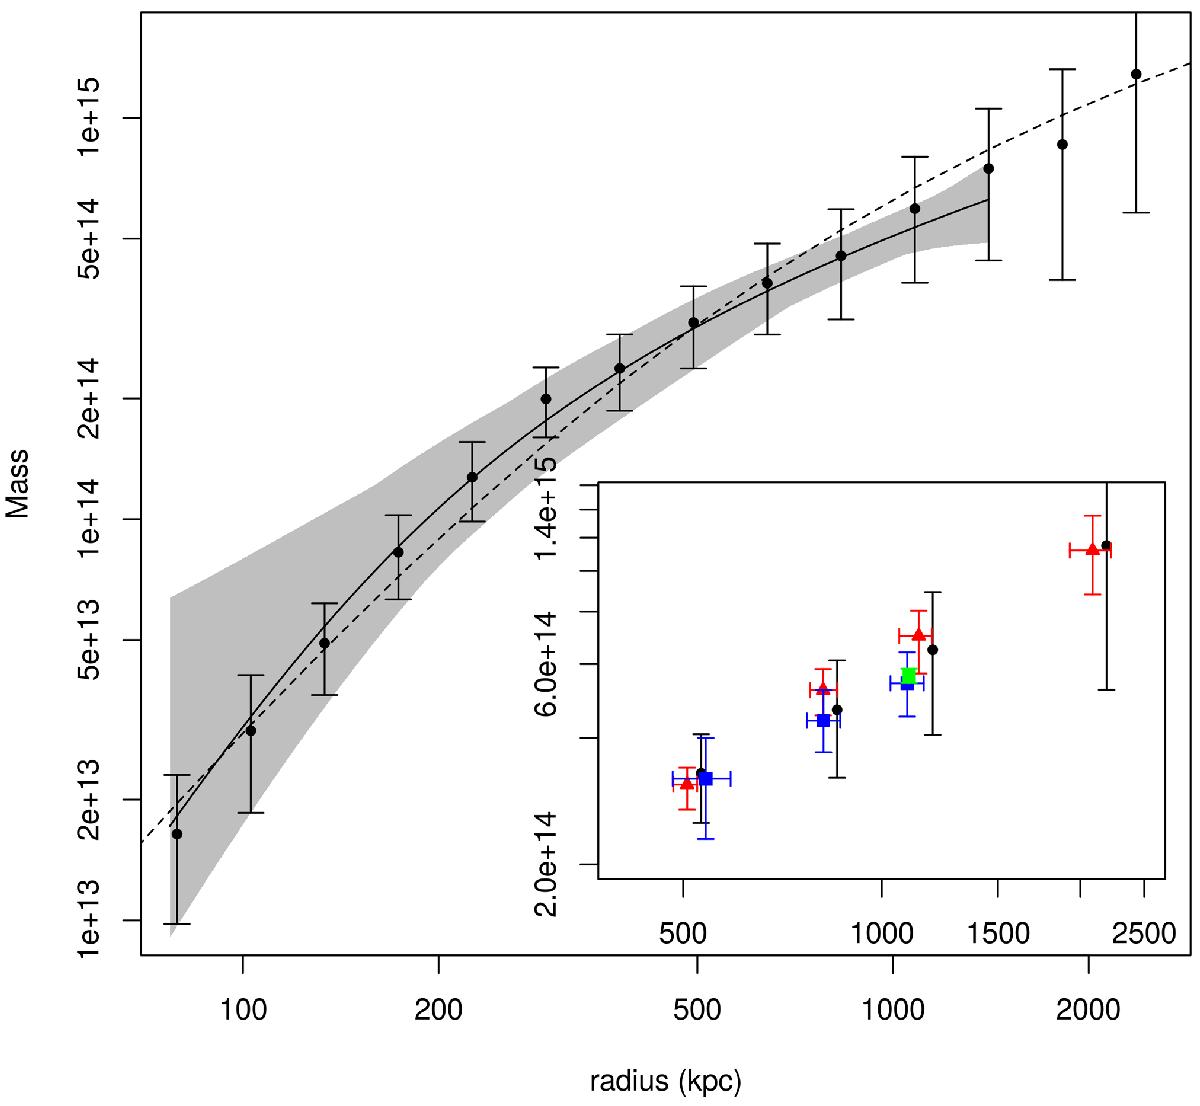
Radial mass profile derived from the X-ray data, where the hydrostatic mass profile and uncertainties are shown by the solid line and the grey area. Error bars represent the 1σ uncertainties described in the text. Also shown are the mass profiles derived from the WL analysis (dashed line: NFW fit; points with error bars: aperture densitometry after deprojection). The inset shows M2500, M1000, M500, and Mvir derived from our XMM analysis (blue squares); the Planck analysis (green squares); WL NFW, first row in Table 2 (red triangles); WL, aperture densitometry (black circles): a small offset in radius is applied here for display purposes.
Current usage metrics show cumulative count of Article Views (full-text article views including HTML views, PDF and ePub downloads, according to the available data) and Abstracts Views on Vision4Press platform.
Data correspond to usage on the plateform after 2015. The current usage metrics is available 48-96 hours after online publication and is updated daily on week days.
Initial download of the metrics may take a while.