Fig. 11
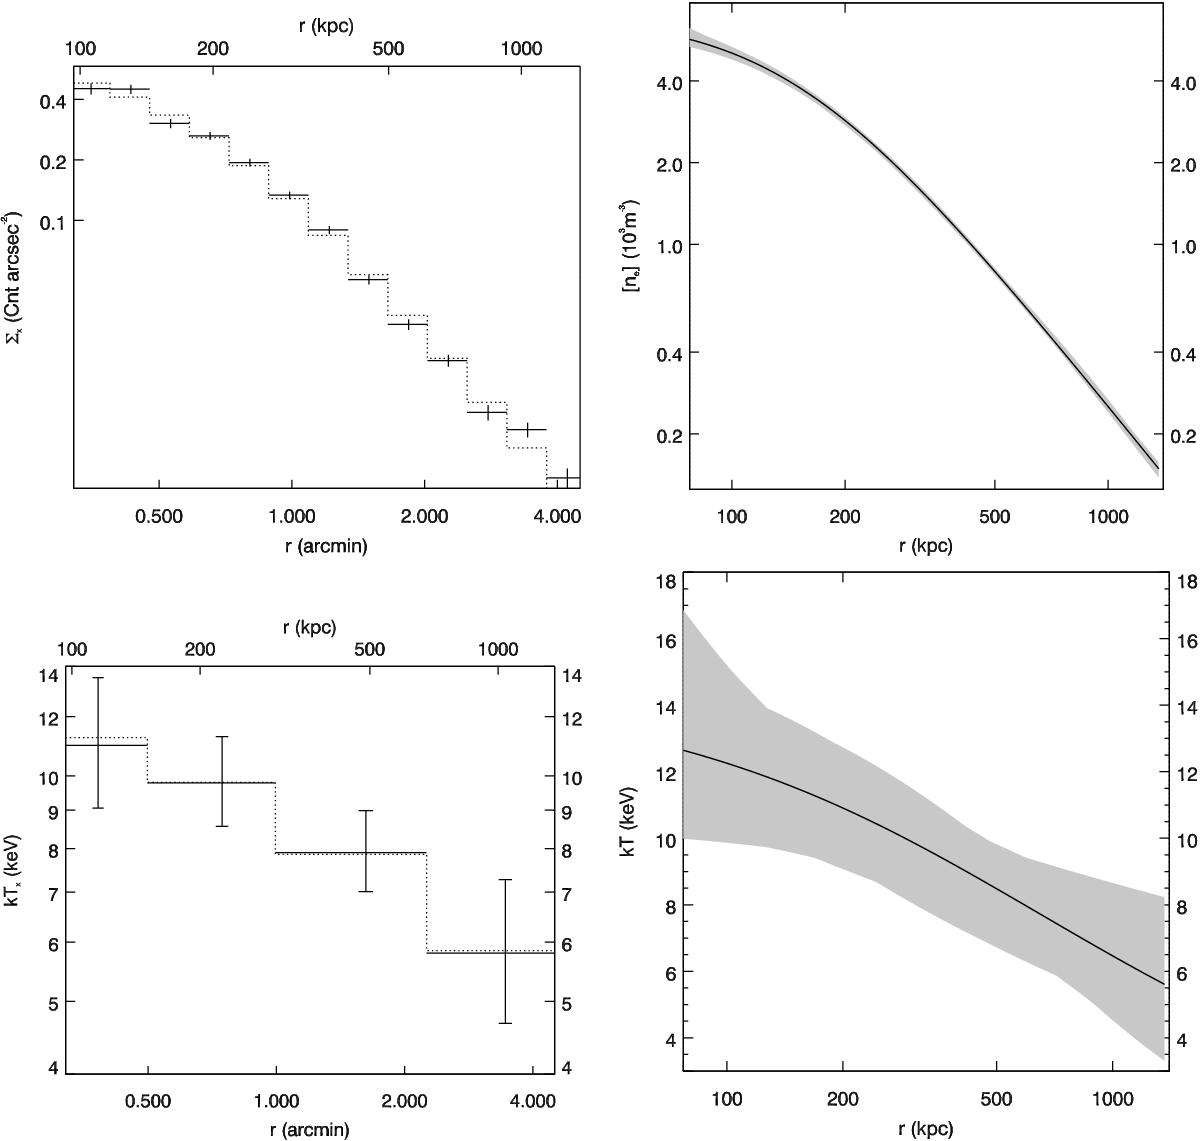
Radial profiles of the X-ray properties are displayed as follows. Top, left: surface brightness in the [0.5–2.5] keV range. Points and the solid line represent the measured data and the best–fit modified beta profile, respectively. Top, right: electron density. Solid line and grey area represent the best-fit model and the relative error, respectively. Bottom, left: measured temperature profile. Points and solid line represent measured data and the temperature profile, respectively. Bottom, right: 3D temperature profile. Solid line and grey area represent the best-fit model and the error, respectively.
Current usage metrics show cumulative count of Article Views (full-text article views including HTML views, PDF and ePub downloads, according to the available data) and Abstracts Views on Vision4Press platform.
Data correspond to usage on the plateform after 2015. The current usage metrics is available 48-96 hours after online publication and is updated daily on week days.
Initial download of the metrics may take a while.