Fig. 10
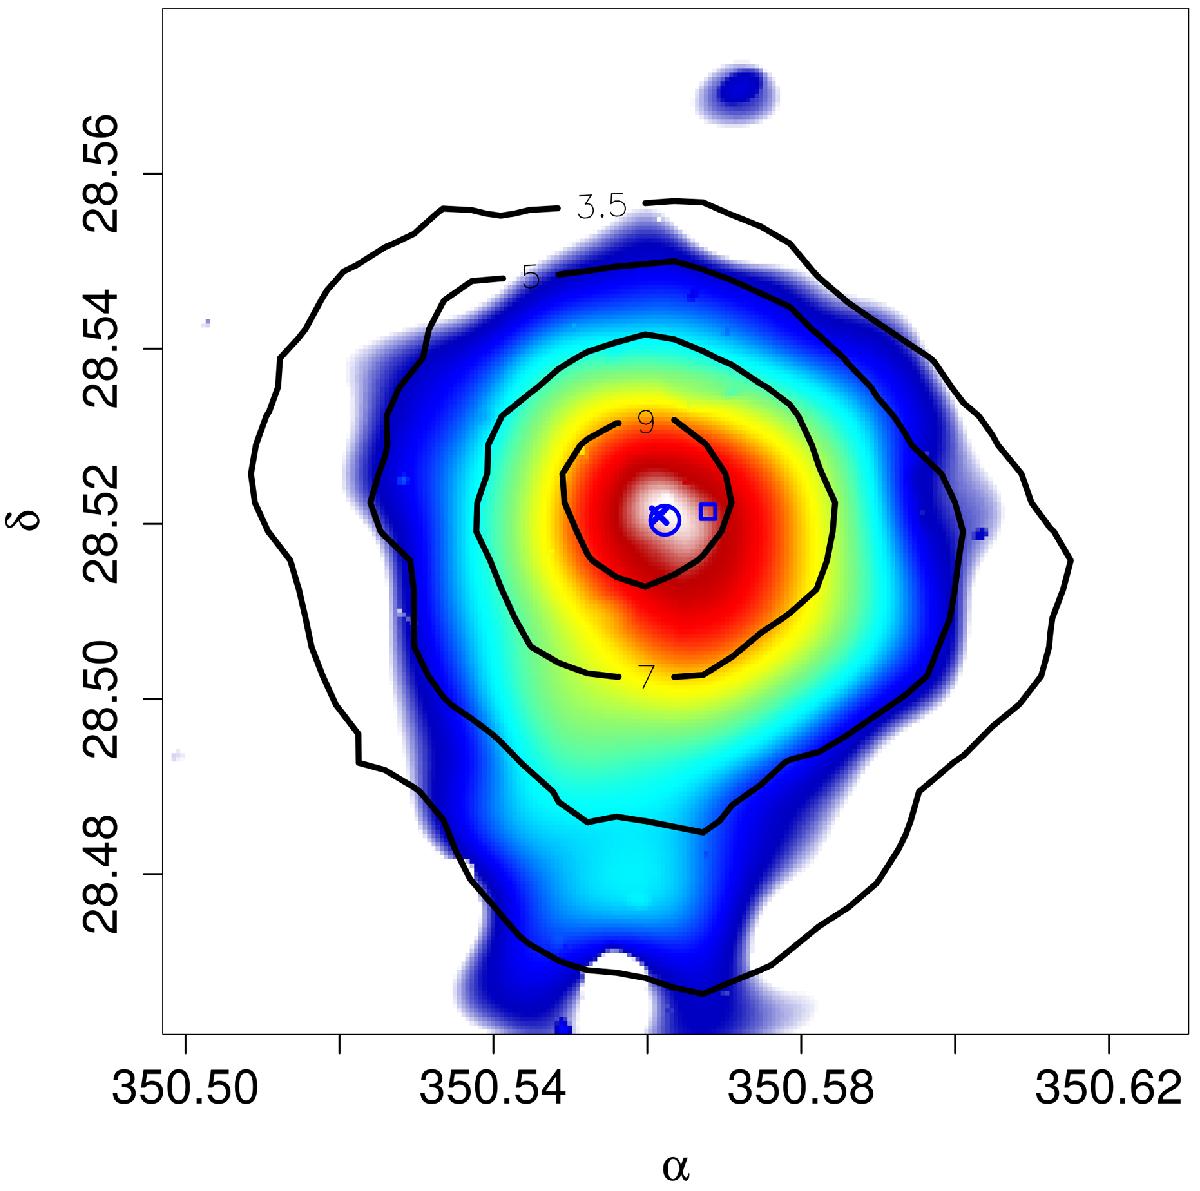
Wavelet reconstructed X-ray image in the [0.5−2.5] keV energy band, obtained from the combination of the three XMM EPIC camera images. The contours show the weak lensing S-map (see Fig. 8), at levels σ = 3.5,5,7,9. The circle denotes the cluster centroid derived by the XMM analysis. The cross and square mark the position of the two brightest cluster galaxies (1 and 2, respectively, in the text).
Current usage metrics show cumulative count of Article Views (full-text article views including HTML views, PDF and ePub downloads, according to the available data) and Abstracts Views on Vision4Press platform.
Data correspond to usage on the plateform after 2015. The current usage metrics is available 48-96 hours after online publication and is updated daily on week days.
Initial download of the metrics may take a while.