Fig. 8
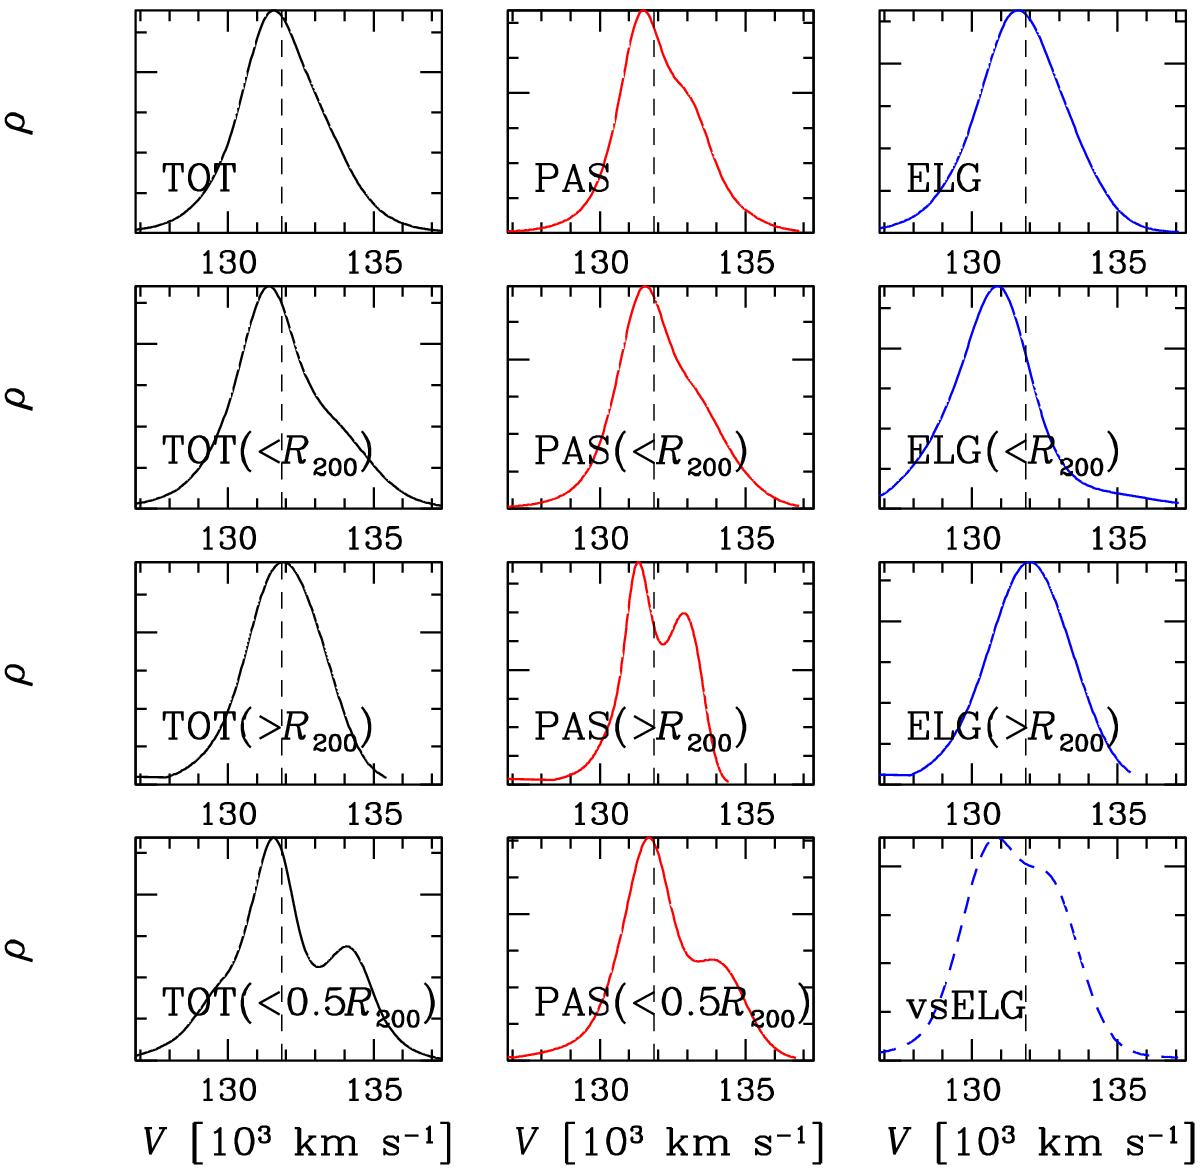
Galaxy density reconstruction in the LOS velocity space through the 1D-DEDICA method. Results for all galaxies in the TOT, PAS, and ELG samples are shown from left to right, while results for the whole and partial cluster regions are shown from top to bottom. The result in the vsELG sample is shown in the bottom-right panel. In each panel, the dashed vertical line indicates the BCG velocity. Units on the y-axis are rescaled to the maximum value of each density distribution.
Current usage metrics show cumulative count of Article Views (full-text article views including HTML views, PDF and ePub downloads, according to the available data) and Abstracts Views on Vision4Press platform.
Data correspond to usage on the plateform after 2015. The current usage metrics is available 48-96 hours after online publication and is updated daily on week days.
Initial download of the metrics may take a while.