Fig. 7
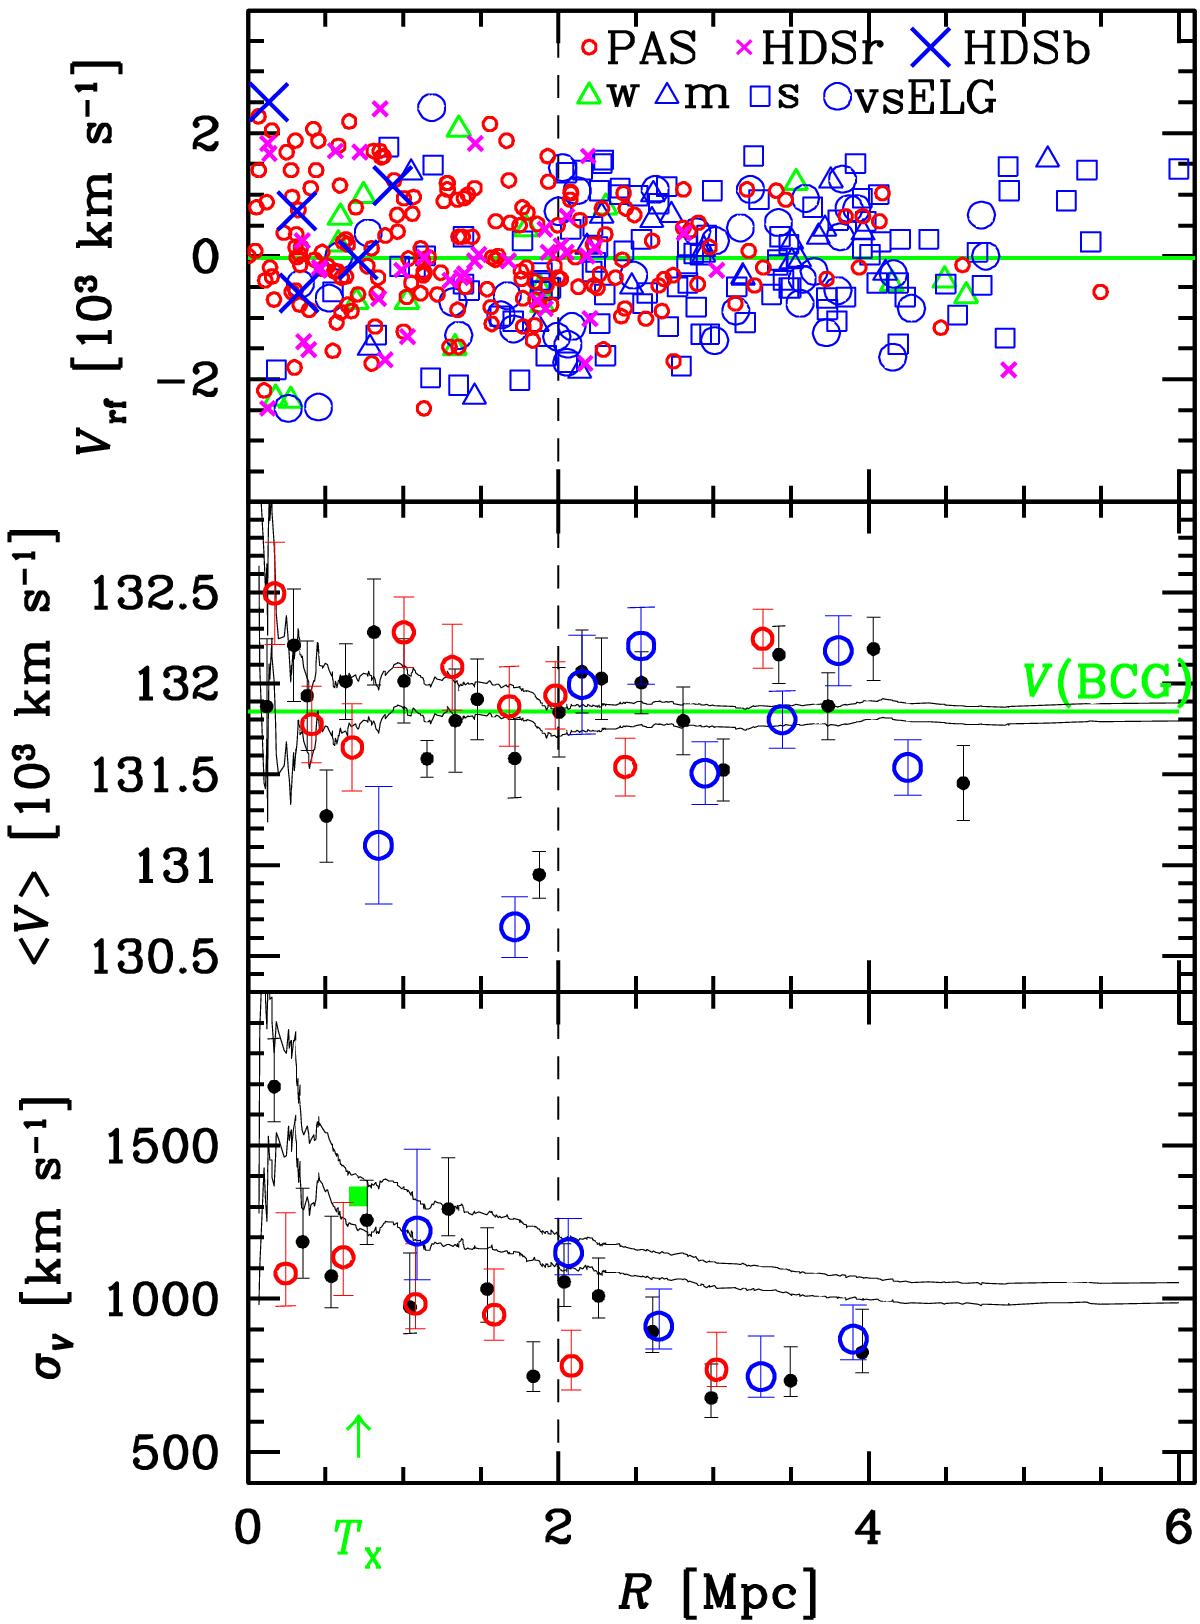
Top panel: rest-frame LOS velocity vs. projected clustercentric distance for galaxies of different spectral classes. The cluster center coincides with the position of the BCG and the vertical dashed line indicates the value of R200. The horizontal green line indicates the BCG velocity. Middle panel: integral profile of the mean LOS velocity shown through its error bands at the 68% c.l. The mean velocity at a given projected radius from the cluster center is estimated by considering all galaxies within that radius. Small black dots, small red circles, and blue circles show the differential profiles for TOT, PAS, and ELG galaxies (each point is the value computed using 20 galaxies). Bottom panel: as in the middle panel, but for the LOS velocity dispersion (here each point is the value computed using 30 galaxies). The green square indicates the estimate of the X-ray temperature TX reported by Postman et al. (2012) using Chandra data within the R = 0.714![]() Mpcradius, indicated by the position of the green arrow, and here converted to σV assuming the density-energy equipartition between ICM and galaxies, i.e., βspec = 1 (see Sect. 5.1).
Mpcradius, indicated by the position of the green arrow, and here converted to σV assuming the density-energy equipartition between ICM and galaxies, i.e., βspec = 1 (see Sect. 5.1).
Current usage metrics show cumulative count of Article Views (full-text article views including HTML views, PDF and ePub downloads, according to the available data) and Abstracts Views on Vision4Press platform.
Data correspond to usage on the plateform after 2015. The current usage metrics is available 48-96 hours after online publication and is updated daily on week days.
Initial download of the metrics may take a while.