Fig. 2
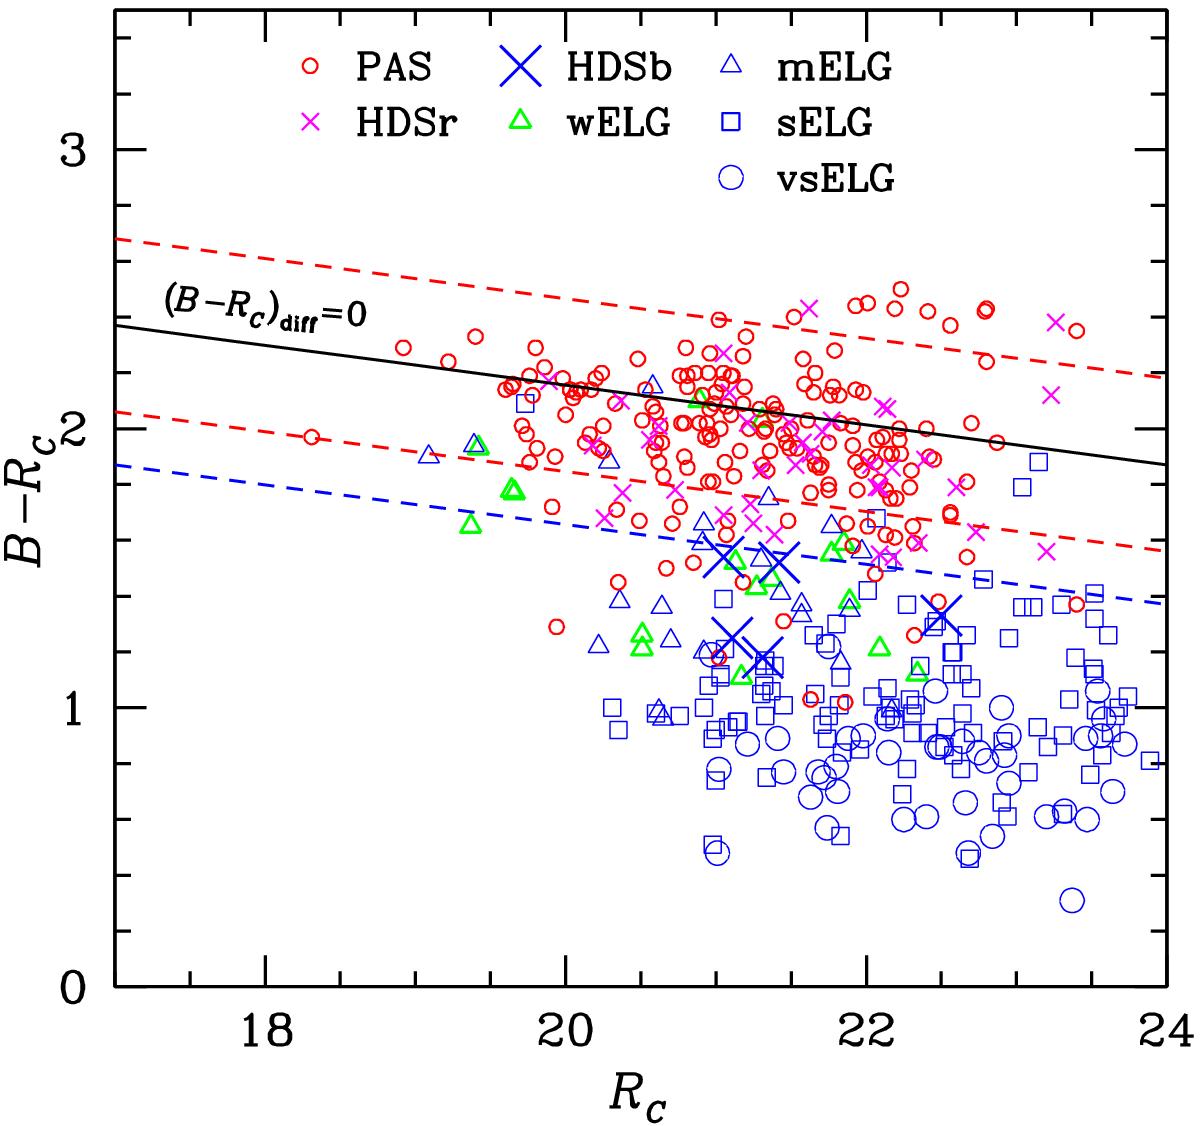
B−RC vs. RC color−magnitude diagram with our seven spectral classes. The black solid line is the color−magnitude relation, (B−RC)diff = 0. The blue dashed line indicates the (B−RC)diff = −0.5 value which we use to separate HDSr and HDSb following M04. The two red dashed lines indicate the locus of the red sequence galaxies, | (B−RC)diff | < 0.3.
Current usage metrics show cumulative count of Article Views (full-text article views including HTML views, PDF and ePub downloads, according to the available data) and Abstracts Views on Vision4Press platform.
Data correspond to usage on the plateform after 2015. The current usage metrics is available 48-96 hours after online publication and is updated daily on week days.
Initial download of the metrics may take a while.