Fig. 19
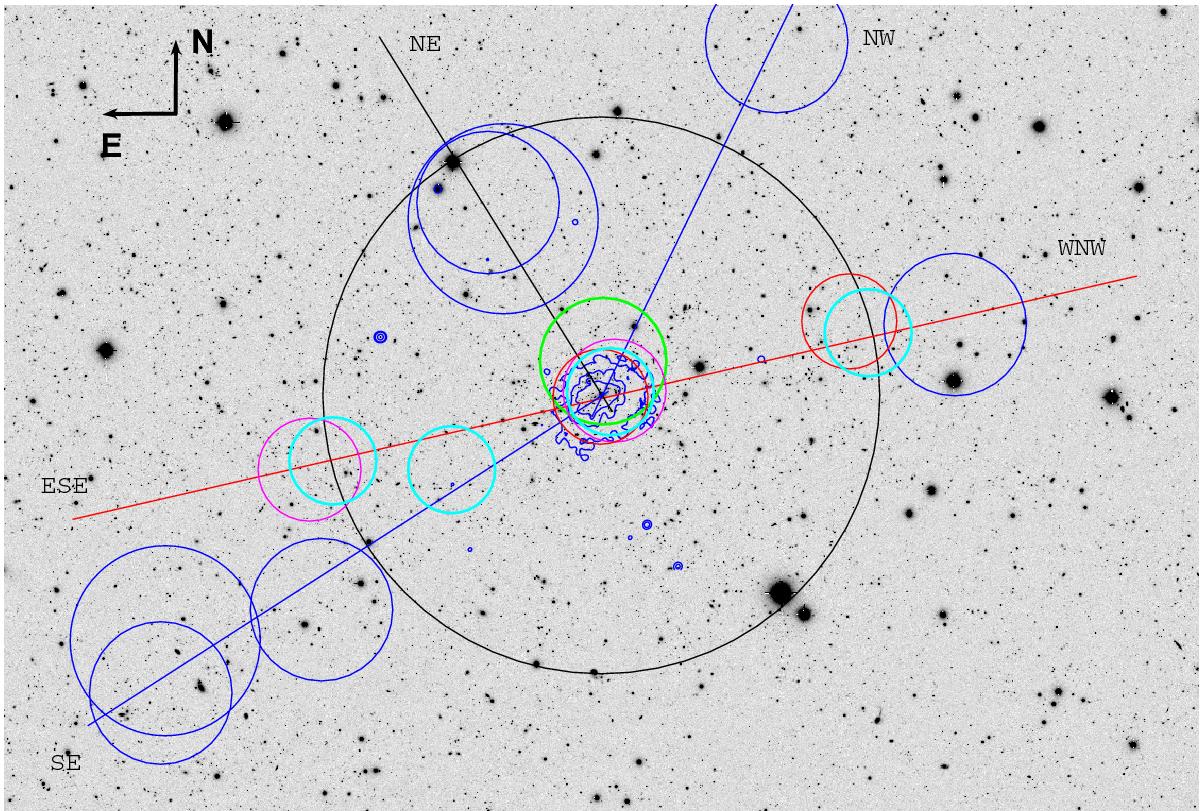
Subaru RC image of MACS1206 with superimposed features summarizing the results of the cluster structure analysis. Circles, in increasing size order, indicate the density peaks detected in the 2D galaxy distribution of TOT (cyan), PAS (red), HDSr (magenta), wELG (green), ELG and vsELG (blue) samples (see Table 6 and Fig. 11); the NE and SEext clumps being also detected through our 3D analysis. The lines indicate the likely directions of cluster accretion. Blue contours are the smoothed contour levels of the X-ray surface brightness derived from Chandra archival data (in the 0.5−2 keV energy range; see also Ebeling et al. 2009). The large black circle encloses the R200 = 2![]() Mpc~ 5.9′ region.
Mpc~ 5.9′ region.
Current usage metrics show cumulative count of Article Views (full-text article views including HTML views, PDF and ePub downloads, according to the available data) and Abstracts Views on Vision4Press platform.
Data correspond to usage on the plateform after 2015. The current usage metrics is available 48-96 hours after online publication and is updated daily on week days.
Initial download of the metrics may take a while.