Fig. 14
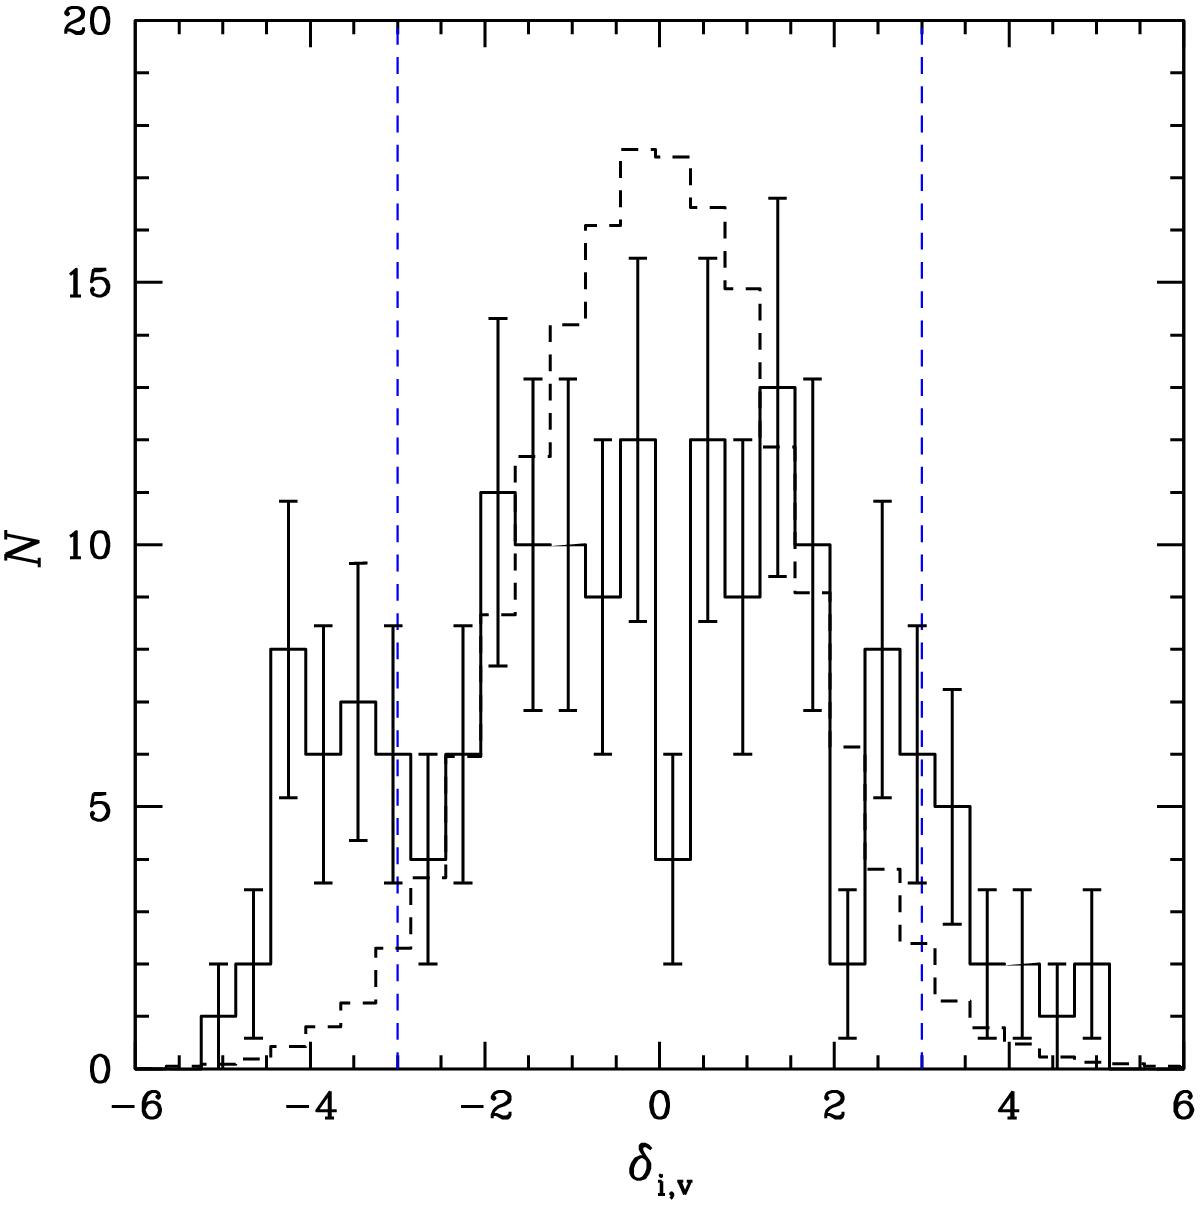
Distribution of the δi,V values for the ELG population. The solid line histogram indicates observed galaxies. The dashed histogram indicates the galaxies of simulated samples, normalized to the observed galaxy number. The blue vertical dashed lines highlight the | δi,V | > 3 regions where most galaxies are expected to belong to the 3D substructure.
Current usage metrics show cumulative count of Article Views (full-text article views including HTML views, PDF and ePub downloads, according to the available data) and Abstracts Views on Vision4Press platform.
Data correspond to usage on the plateform after 2015. The current usage metrics is available 48-96 hours after online publication and is updated daily on week days.
Initial download of the metrics may take a while.