Fig. 12
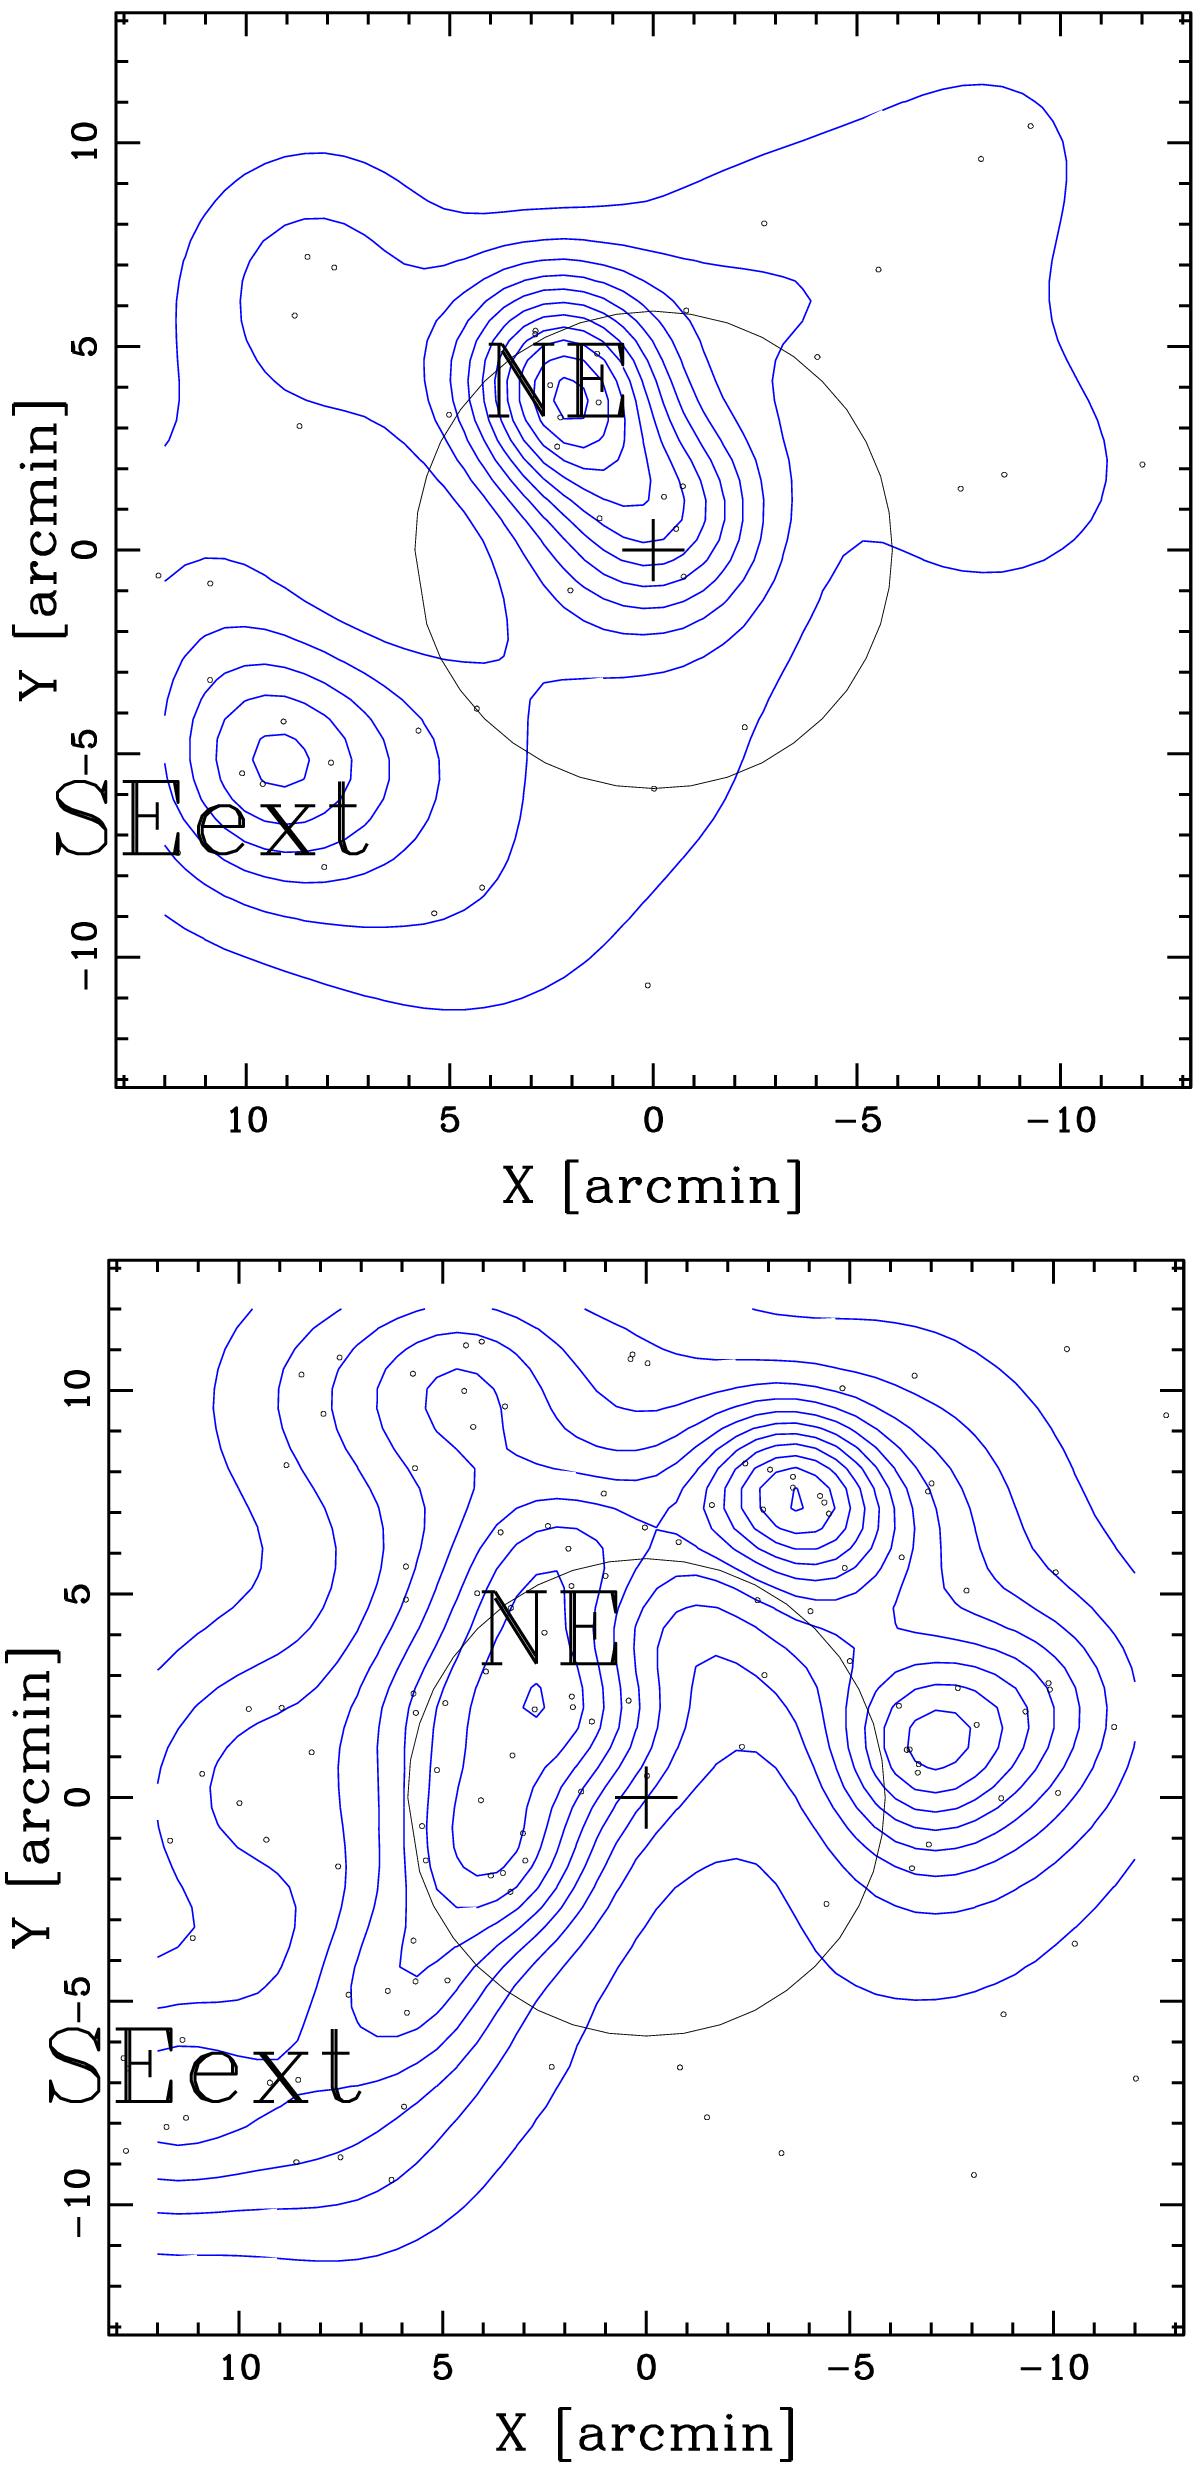
Spatial distribution and isodensity contour maps of vsELGs (upper panel) and other ELGs (i.e., mELGs+sELGs, lower panel). The position of labels are those in Fig. 11 (lower right panel) to allow an easy comparison with that figure and highlight the concentration of vsELGs in the NE and SEext structures. The R200 region is indicated by the circle centered on the BCG.
Current usage metrics show cumulative count of Article Views (full-text article views including HTML views, PDF and ePub downloads, according to the available data) and Abstracts Views on Vision4Press platform.
Data correspond to usage on the plateform after 2015. The current usage metrics is available 48-96 hours after online publication and is updated daily on week days.
Initial download of the metrics may take a while.