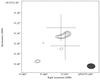
Fig. 7
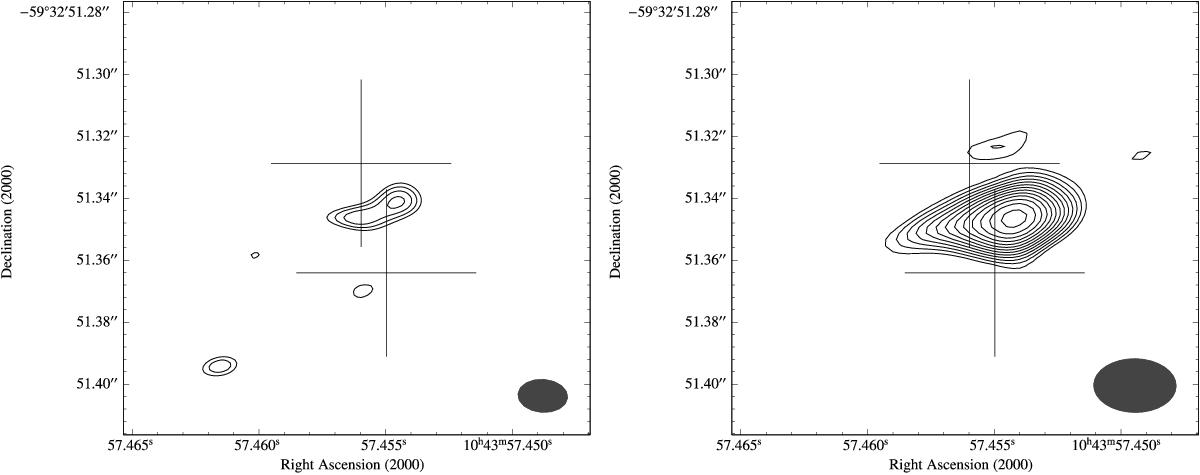
LBA observations of HD 93129A at 2.3 GHz. a) Left: at highest angular resolution with an image rms of 0.21 mJy beam-1 and contour levels shown for −0.6, 0.6 (3σ), 0.7, 0.8, and 0.9 mJy beam-1. b) Right: a tapered image that increases the weight of the shorter baselines and increases sensitivity to larger scale emission; the image rms is 0.13 mJy beam-1 and the contour levels are −0.4, 0.4 (3σ), 0.6, 1, 1.4, and 1.8 mJy beam-1. The synthesized beams are 15 mas × 11 mas and 31 mas × 23 mas, respectively, shown in the bottom righthand corner of the images. The crosses mark the positions of the system components Aa (south) and Ab (north), at the epoch of the radio observations based on the position derived in Sect. 2. North is up and east is to the left.
Current usage metrics show cumulative count of Article Views (full-text article views including HTML views, PDF and ePub downloads, according to the available data) and Abstracts Views on Vision4Press platform.
Data correspond to usage on the plateform after 2015. The current usage metrics is available 48-96 hours after online publication and is updated daily on week days.
Initial download of the metrics may take a while.