Free Access
Fig. 5
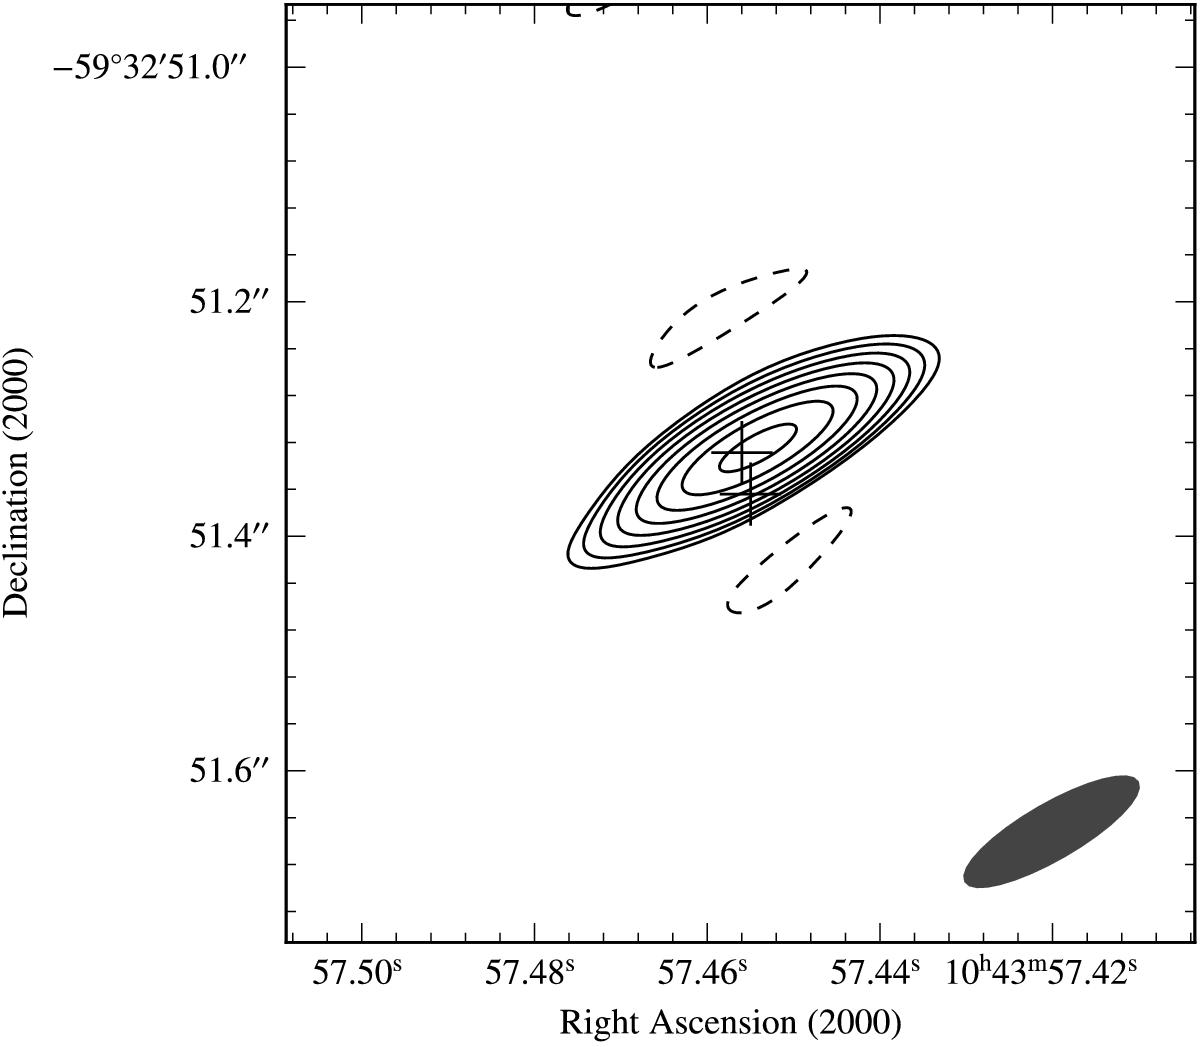
HD 93129Aab system from 2007 LBA data (in contours) and location of stars Aa (southern) and Ab (northern) marked with crosses. The contours start at 0.3 mJy beam-1 (3σ) and increase by factors of 21/2. The synthesized beam (0.2′′ × 0.05′′, PA = 31°) is shown in the bottom right corner. North is up and east to the left.
Current usage metrics show cumulative count of Article Views (full-text article views including HTML views, PDF and ePub downloads, according to the available data) and Abstracts Views on Vision4Press platform.
Data correspond to usage on the plateform after 2015. The current usage metrics is available 48-96 hours after online publication and is updated daily on week days.
Initial download of the metrics may take a while.