Fig. 4
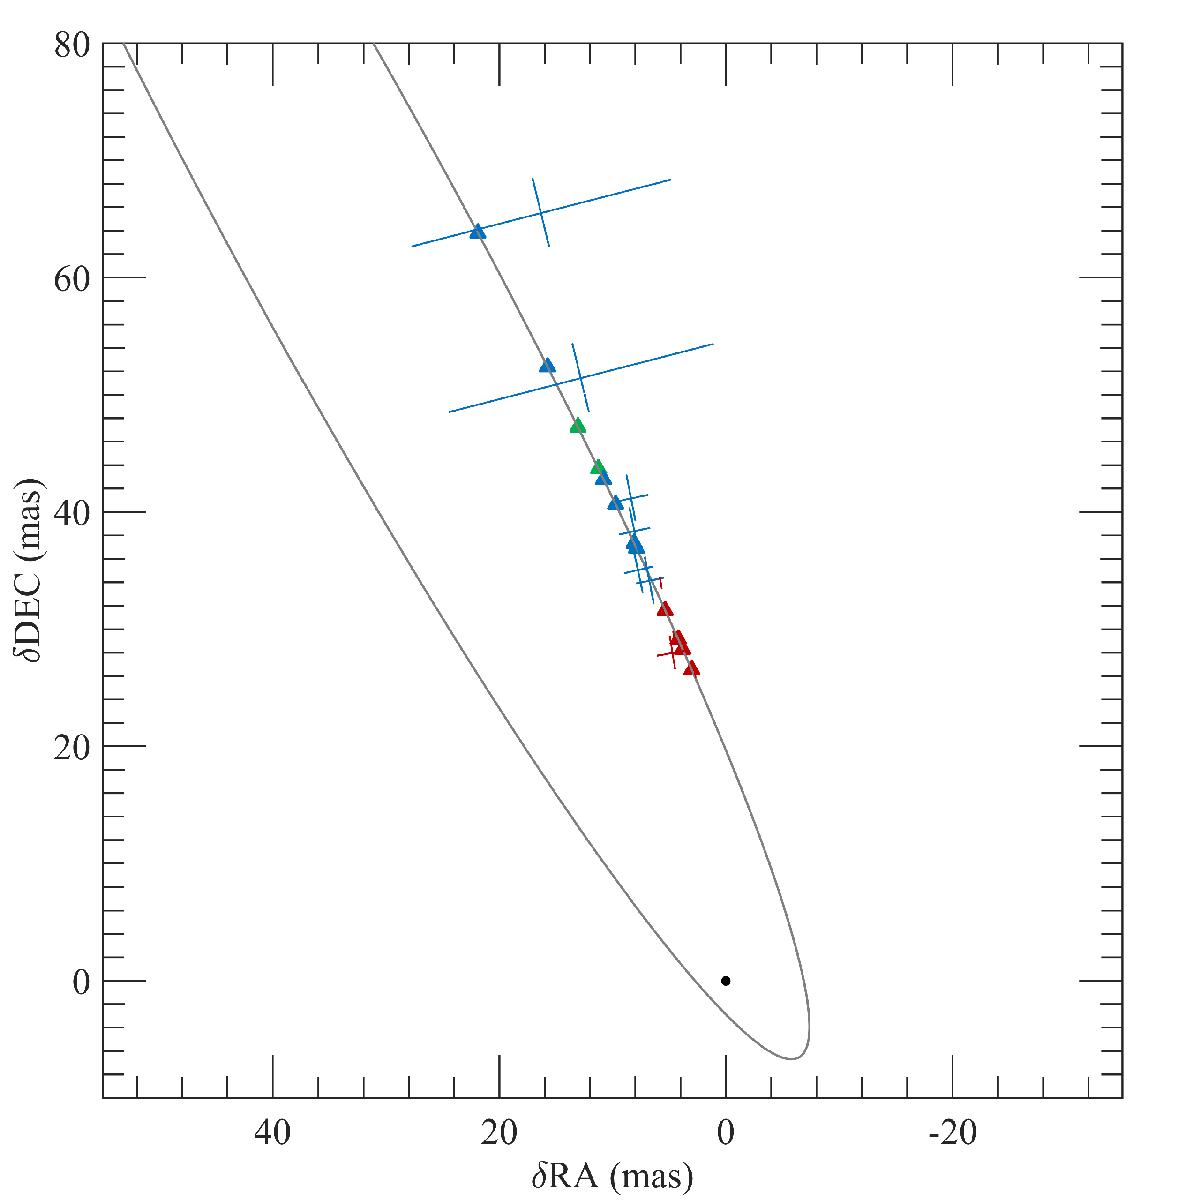
Preliminary fit for the orbit (triangles: same dates as in Fig. 1 in blue and red plus 2004.6 and 2006.2 in green). The primary Aa is at the origin, The different positions of the secondary Ab between 1996 and 2013 are represented with crosses, and are the same as in Fig. 1. The figure shows the projection of the preliminary orbit in the plane of the sky.
Current usage metrics show cumulative count of Article Views (full-text article views including HTML views, PDF and ePub downloads, according to the available data) and Abstracts Views on Vision4Press platform.
Data correspond to usage on the plateform after 2015. The current usage metrics is available 48-96 hours after online publication and is updated daily on week days.
Initial download of the metrics may take a while.