Fig. 8
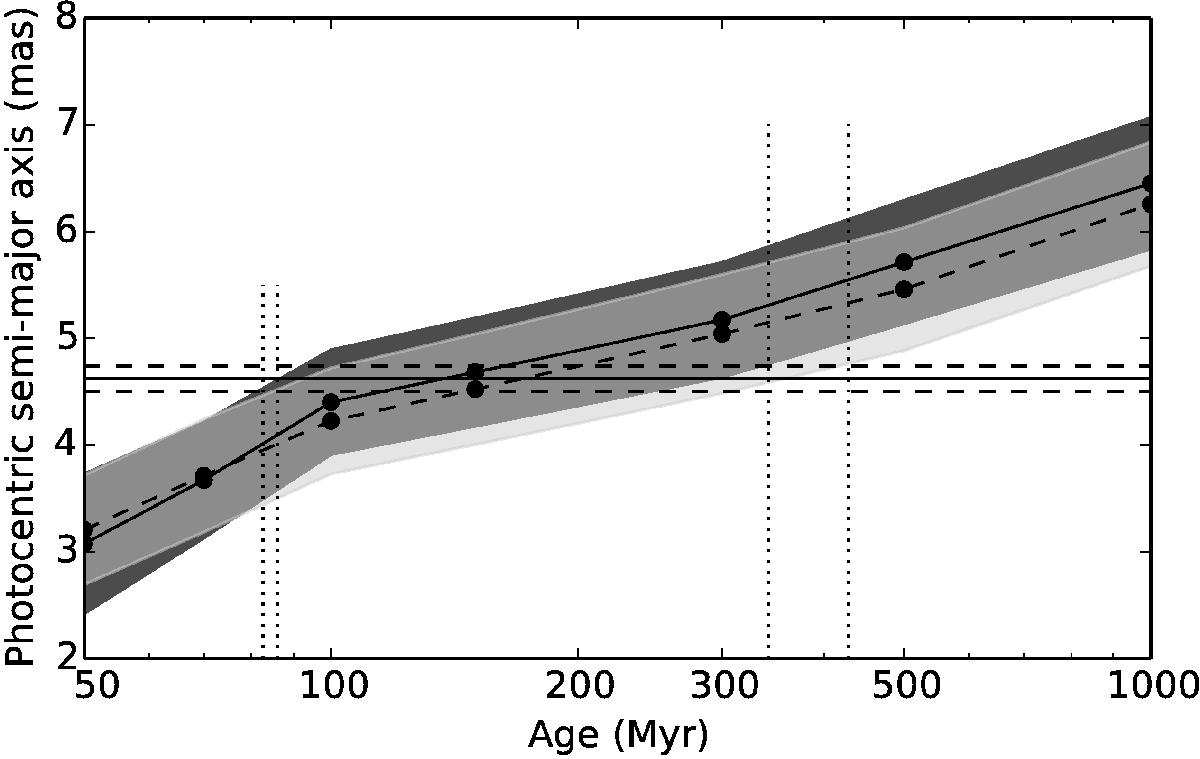
Age constraints derived on the basis of two sets of evolutionary models, derived using effective temperature – mass relationships. The curves shows the photocentric orbit size αC for various ages and fixed effective temperatures, where the solid and dashed curve corresponds to the DUSTY and Saumon & Marley (2008) models, respectively. The shaded regions delineate the uncertainties (dark grey for DUSTY, light grey for Saumon & Marley 2008). The horizontal lines show the measured value of α and its uncertainty. Vertical dotted lines indicate age limits derived from the photocentric orbit.
Current usage metrics show cumulative count of Article Views (full-text article views including HTML views, PDF and ePub downloads, according to the available data) and Abstracts Views on Vision4Press platform.
Data correspond to usage on the plateform after 2015. The current usage metrics is available 48-96 hours after online publication and is updated daily on week days.
Initial download of the metrics may take a while.