Fig. 2
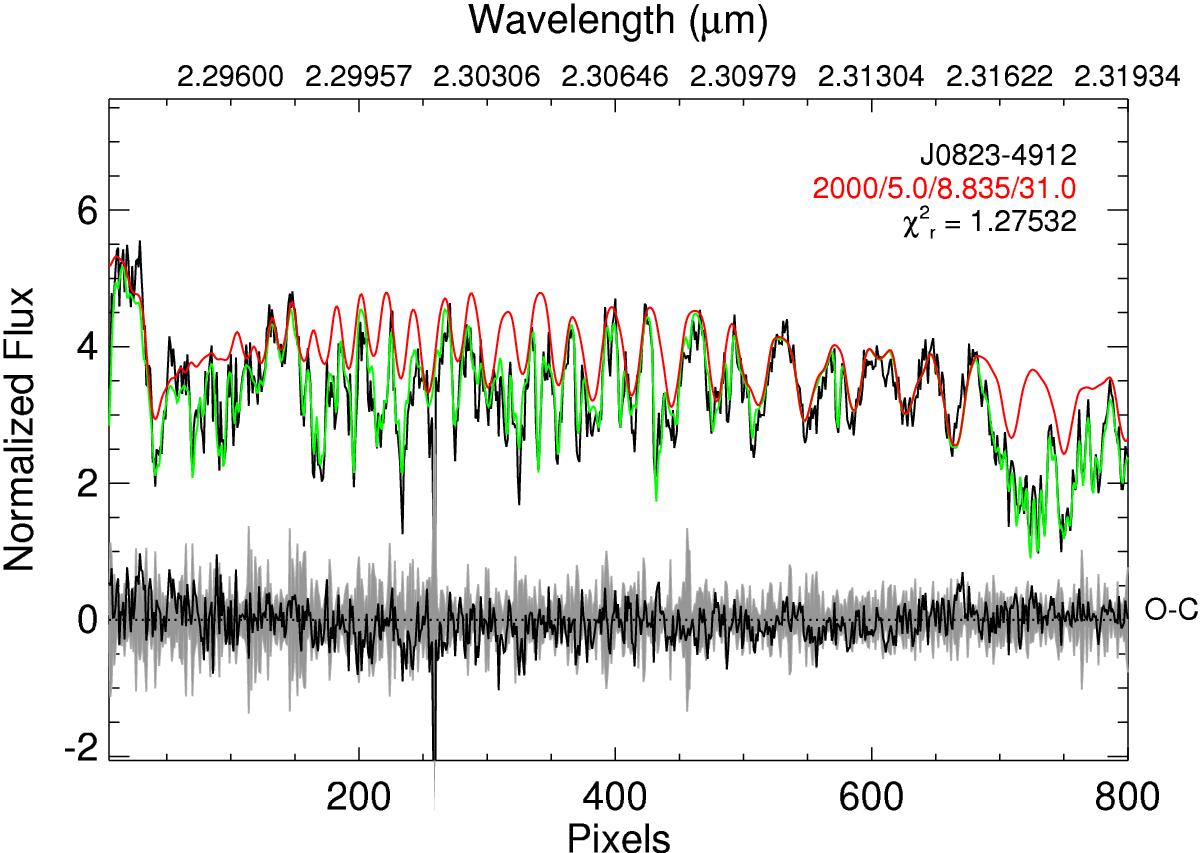
High-resolution K-band spectrum of DE0823−49 obtained with NIRSPEC (black line) compared to a best-fit spectral (red line) and spectral plus telluric model (green line). Difference between data and model is plotted in black at bottom; the uncertainty spectrum is indicated in grey. The values listed below the target name on the top right are Teff/log g/RV/vsini.
Current usage metrics show cumulative count of Article Views (full-text article views including HTML views, PDF and ePub downloads, according to the available data) and Abstracts Views on Vision4Press platform.
Data correspond to usage on the plateform after 2015. The current usage metrics is available 48-96 hours after online publication and is updated daily on week days.
Initial download of the metrics may take a while.