Fig. 8
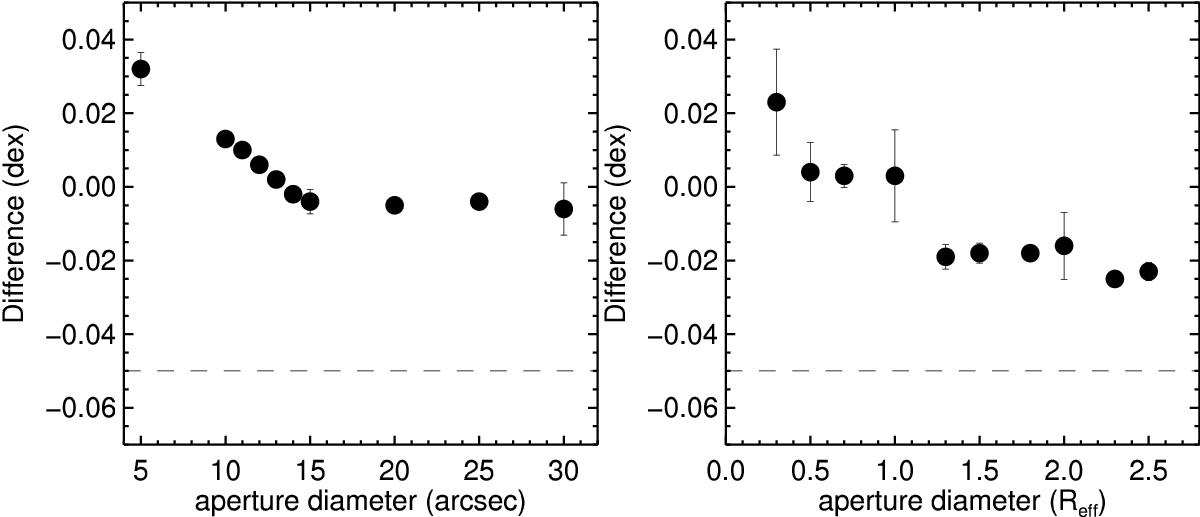
Differences in the median values of ΔO/H between the interacting and control samples at different aperture sizes. Left: aperture sizes are measured in arcsecs. Right: aperture scales are measured in effective radius. The dashed line represents the difference reported by Ellison et al. (2008). Errors bars are determined using bootstrapping in both samples. On any of the scales, the differences reach the values found in single-fiber spectrocopic studies.
Current usage metrics show cumulative count of Article Views (full-text article views including HTML views, PDF and ePub downloads, according to the available data) and Abstracts Views on Vision4Press platform.
Data correspond to usage on the plateform after 2015. The current usage metrics is available 48-96 hours after online publication and is updated daily on week days.
Initial download of the metrics may take a while.