Fig. 2
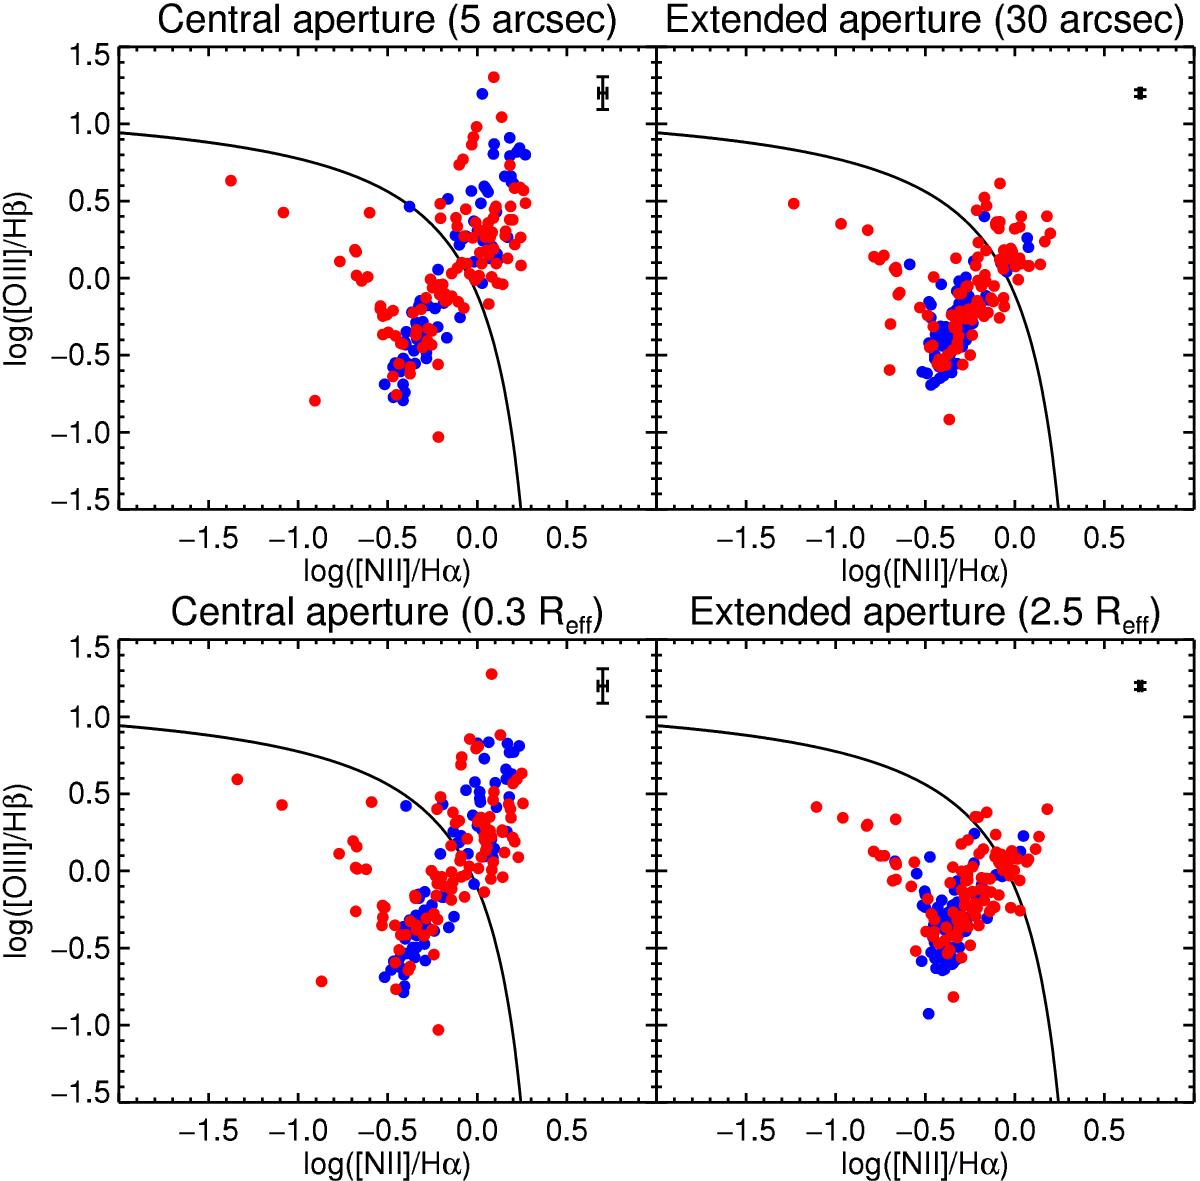
BPT diagnostic diagrams for the control (blue points) and interacting (red points) samples measured within a central (left panels) and extended (right panels) apertures centered in the optical nucleus. Fluxes in top panels are derived using apertures on an arcsec scale, while fluxes in the bottom panel are obtained using an effective radius scale. The solid lines in each panel represent the division between star-forming and non-star-forming galaxies presented in Kewley et al. (2001). The typical uncertainty is plotted at the top of each panel.
Current usage metrics show cumulative count of Article Views (full-text article views including HTML views, PDF and ePub downloads, according to the available data) and Abstracts Views on Vision4Press platform.
Data correspond to usage on the plateform after 2015. The current usage metrics is available 48-96 hours after online publication and is updated daily on week days.
Initial download of the metrics may take a while.