Fig. 5
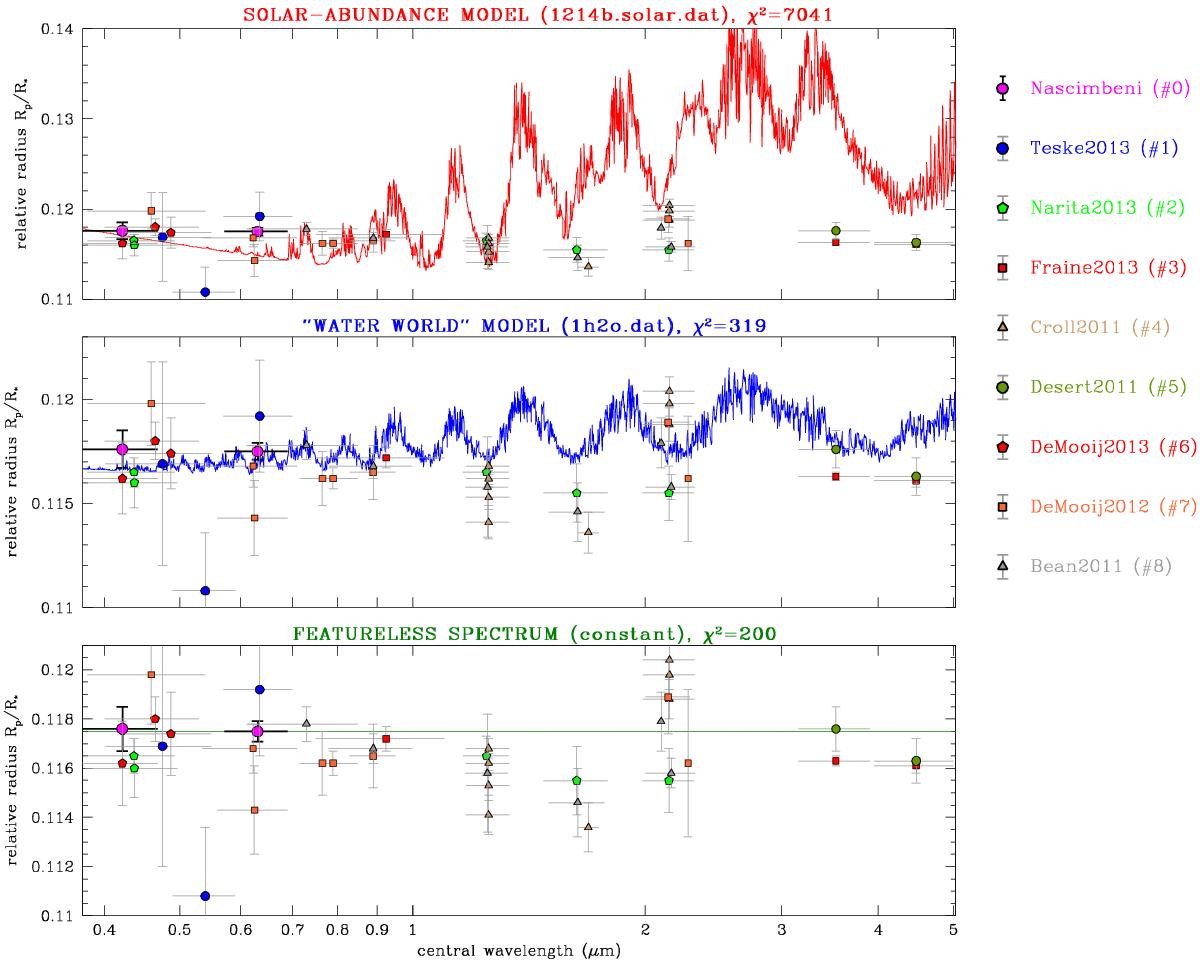
Transmission spectrum of GJ1214b reconstructed by merging results from the present work (magenta circles) with all the published data that assumed the same prior as we did on i and a/R⋆ (see the legend on the right). Theoretical models with different compositions calculated for GJ1214b by Howe & Burrows (2012) are plotted with solid lines. Upper panel: low μ, cloud-free atmosphere with solar composition (red line). Middle panel: high μ, cloud-free atmosphere composed by pure water (blue line). Lower panel: featureless (constant) spectrum simulating a high-altitude layer of opaque clouds (green line). The corresponding χ2 values are reported for each case.
Current usage metrics show cumulative count of Article Views (full-text article views including HTML views, PDF and ePub downloads, according to the available data) and Abstracts Views on Vision4Press platform.
Data correspond to usage on the plateform after 2015. The current usage metrics is available 48-96 hours after online publication and is updated daily on week days.
Initial download of the metrics may take a while.