Fig. 4
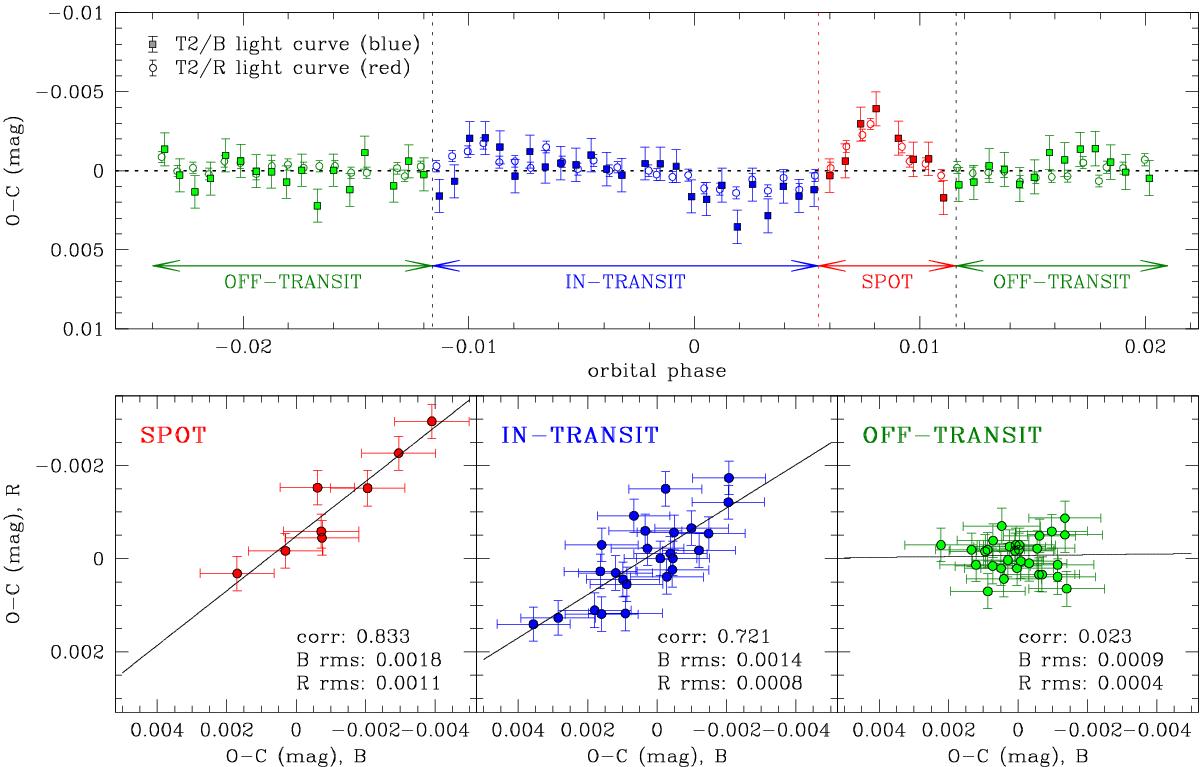
Statistical correlation between the blue (T2/B) and red (T2/R) LBC light curve of the second transit. Upper panel: observed minus calculated (O−C) residuals from the best-fit transit model as a function of orbital phase for the T2/B (square points) and the T2/R (round points) time series. Data are color-coded according to whether they are labeled as off-transit, in-transit (the spot feature being excluded) and spot only. Only points whose mid-exposure time can be matched within 30 s to a frame of the other channel are considered here. Lower panels: correlation plots between residuals from T2/B and T2/R light curves for the three samples defined above. The best-fit straight line calculated by ordinary least-squares is overplotted. The Spearman rank correlation coefficient is tabulated for each subset, along with the blue and red RMS.
Current usage metrics show cumulative count of Article Views (full-text article views including HTML views, PDF and ePub downloads, according to the available data) and Abstracts Views on Vision4Press platform.
Data correspond to usage on the plateform after 2015. The current usage metrics is available 48-96 hours after online publication and is updated daily on week days.
Initial download of the metrics may take a while.