Fig. 3
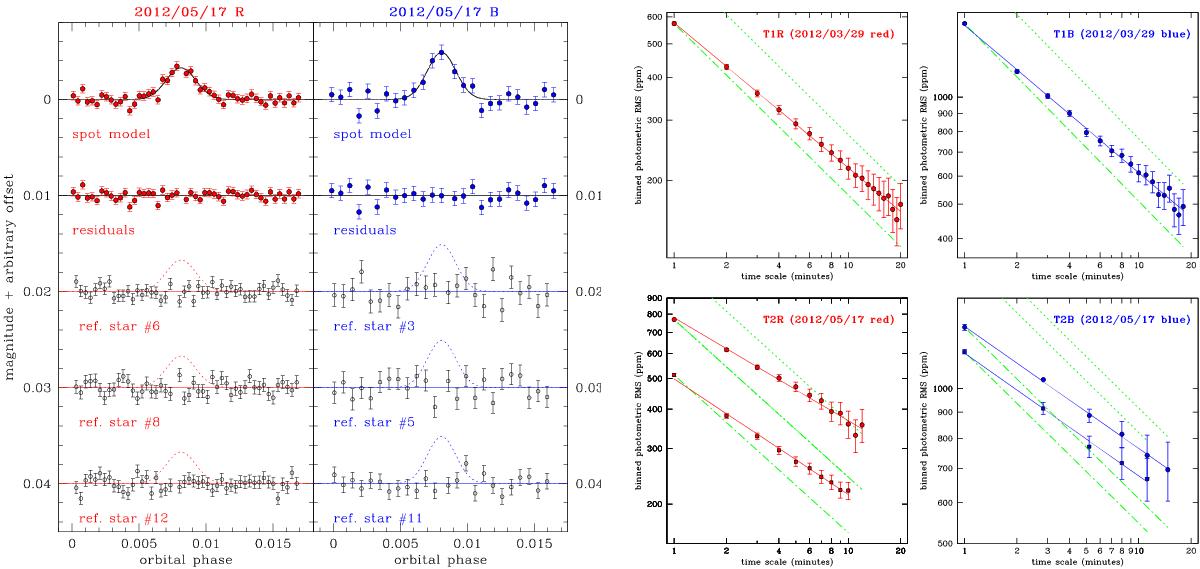
Left panel: modeling of the T2/R (left plots) and T2/B (right plots) light-curve bumps. From the top: residual light curves with the best-fit Gaussian model overplotted (black line; Table 1), residuals from the Gaussian fit, and light curves of three reference stars with a red color and magnitude similar to GJ1214. Within the errors, the bump-like feature is not seen in any other light curve. Right panel: correlated noise diagrams (photometric RMS of the binned time series as a function of bin size) for the GJ1214b LBC residual light curves after the best-fit transit model has been subtracted. The lower sequence in the T2/B, T2/R plots is evaluated after the starspot feature has been masked out. The green lines follow a Poisson-like ![]() scaling law as extrapolated from the RMS of the unbinned curve (dotted-dashed line), and with a 50% increase as reference (dotted line).
scaling law as extrapolated from the RMS of the unbinned curve (dotted-dashed line), and with a 50% increase as reference (dotted line).
Current usage metrics show cumulative count of Article Views (full-text article views including HTML views, PDF and ePub downloads, according to the available data) and Abstracts Views on Vision4Press platform.
Data correspond to usage on the plateform after 2015. The current usage metrics is available 48-96 hours after online publication and is updated daily on week days.
Initial download of the metrics may take a while.