Fig. 2
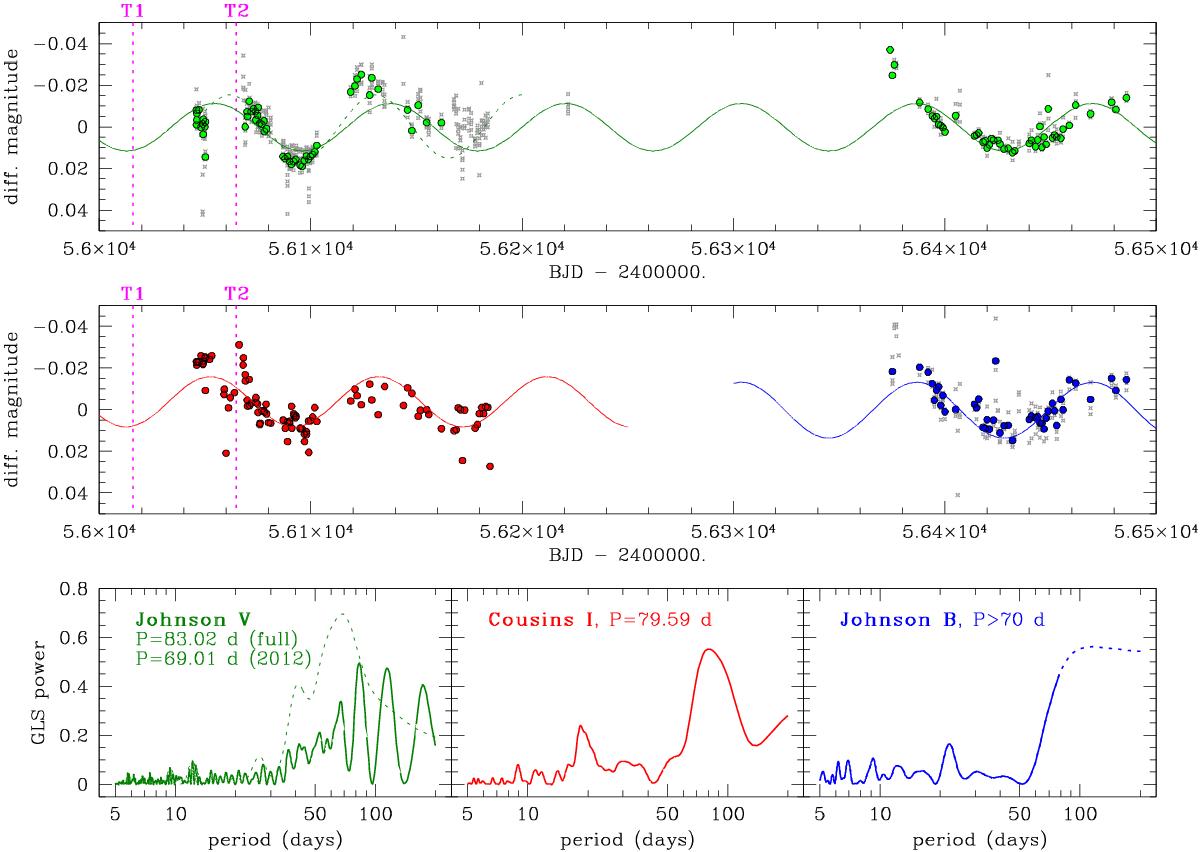
Upper panel: STELLA/WiFSIP differential light curve of GJ1214b, gathered through a Bessel V filter during the 2012 and 2013 observing seasons. Unbinned points are shown in gray, daily averages are plotted with green points. Epochs corresponding to the two transits observed by LBC (T1 and T2) are marked with vertical lines. Middle panel: same as above, but through a Bessel I filter in 2012 (red points) and Bessel B in 2013 (blue points). Lower panels: GLS periodograms of the light curves, plotted with matching colors. The V periodogram has been evaluated on both the whole 2012/2013 data set (solid line) and only on the 2012 season (dashed line). The best-fit period, or the lower limit to it, is reported for each periodogram.
Current usage metrics show cumulative count of Article Views (full-text article views including HTML views, PDF and ePub downloads, according to the available data) and Abstracts Views on Vision4Press platform.
Data correspond to usage on the plateform after 2015. The current usage metrics is available 48-96 hours after online publication and is updated daily on week days.
Initial download of the metrics may take a while.