Fig. 1
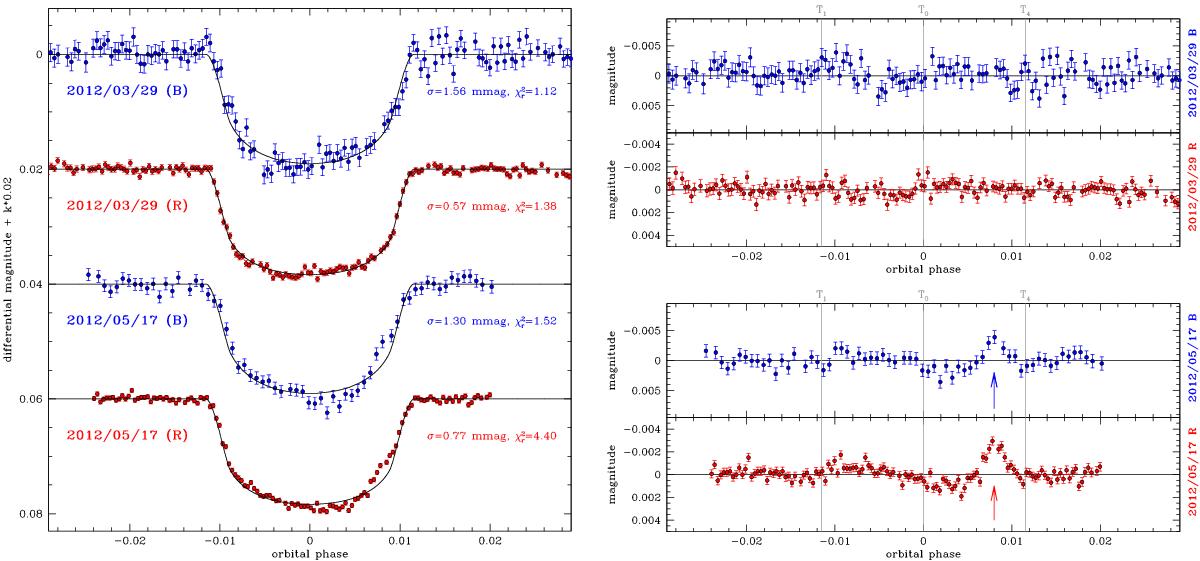
Left panel: light curves of GJ1214b gathered through the blue channel of LBC in the Bessel B band (blue points), and through the red channel in Bessel R (red points). Data points are plotted with the original sampling cadence. The black line corresponds to the best-fit model adopting the parameters listed in Table 2. Right panel: same as above, but showing the residuals from the best-fit model. The bump-like feature at phase 0.070 ≲ φ ≲ 0.092 appeared during the second transit and is interpreted as a starspot crossing; it is marked with an arrow in both channels.
Current usage metrics show cumulative count of Article Views (full-text article views including HTML views, PDF and ePub downloads, according to the available data) and Abstracts Views on Vision4Press platform.
Data correspond to usage on the plateform after 2015. The current usage metrics is available 48-96 hours after online publication and is updated daily on week days.
Initial download of the metrics may take a while.