Fig. 5
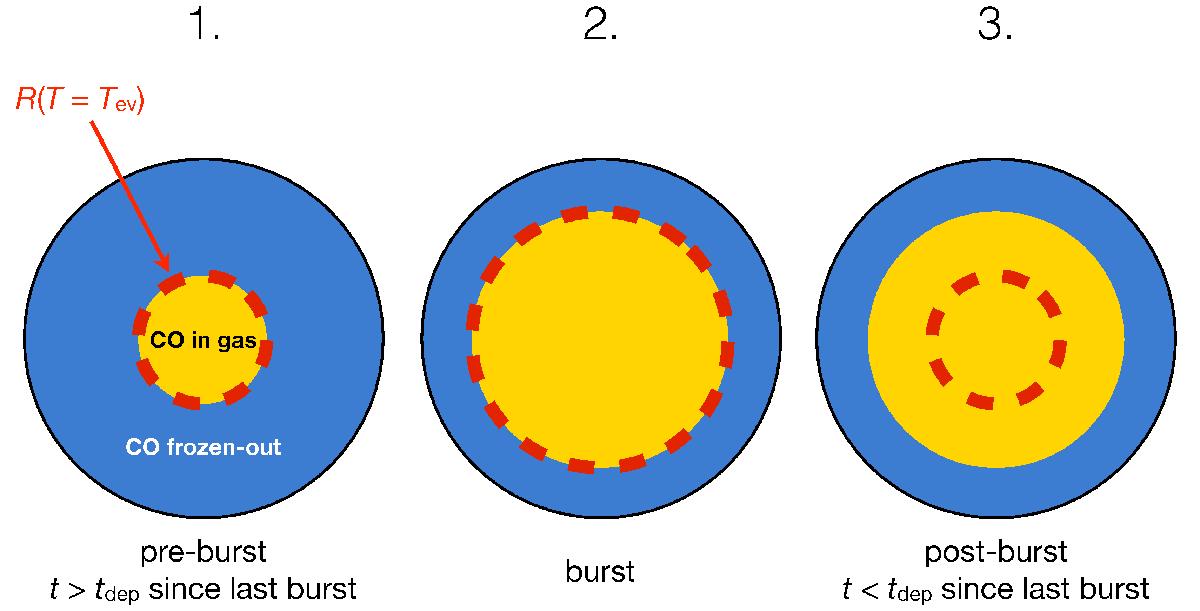
Interpretation of the extended CO emission signatures due to variations in source luminosities. The dark blue and yellow regions indicate where CO is frozen out and in the gas-phase in three characteristic situations around a protostellar burst in luminosity. The red dashed line is the radius where the temperature in the envelope reaches the sublimation temperature for CO. The three panels indicate the situations (1) just before a burst where the CO sublimates out to a radius defined by the current luminosity of the protostar; (2) during a burst where the luminosity of the protostar increases and the CO sublimation radius moves outward; and (3) immediately after a burst where CO remains in the gas-phase in a large region and before it freezes-out again.
Current usage metrics show cumulative count of Article Views (full-text article views including HTML views, PDF and ePub downloads, according to the available data) and Abstracts Views on Vision4Press platform.
Data correspond to usage on the plateform after 2015. The current usage metrics is available 48-96 hours after online publication and is updated daily on week days.
Initial download of the metrics may take a while.