Fig. 4
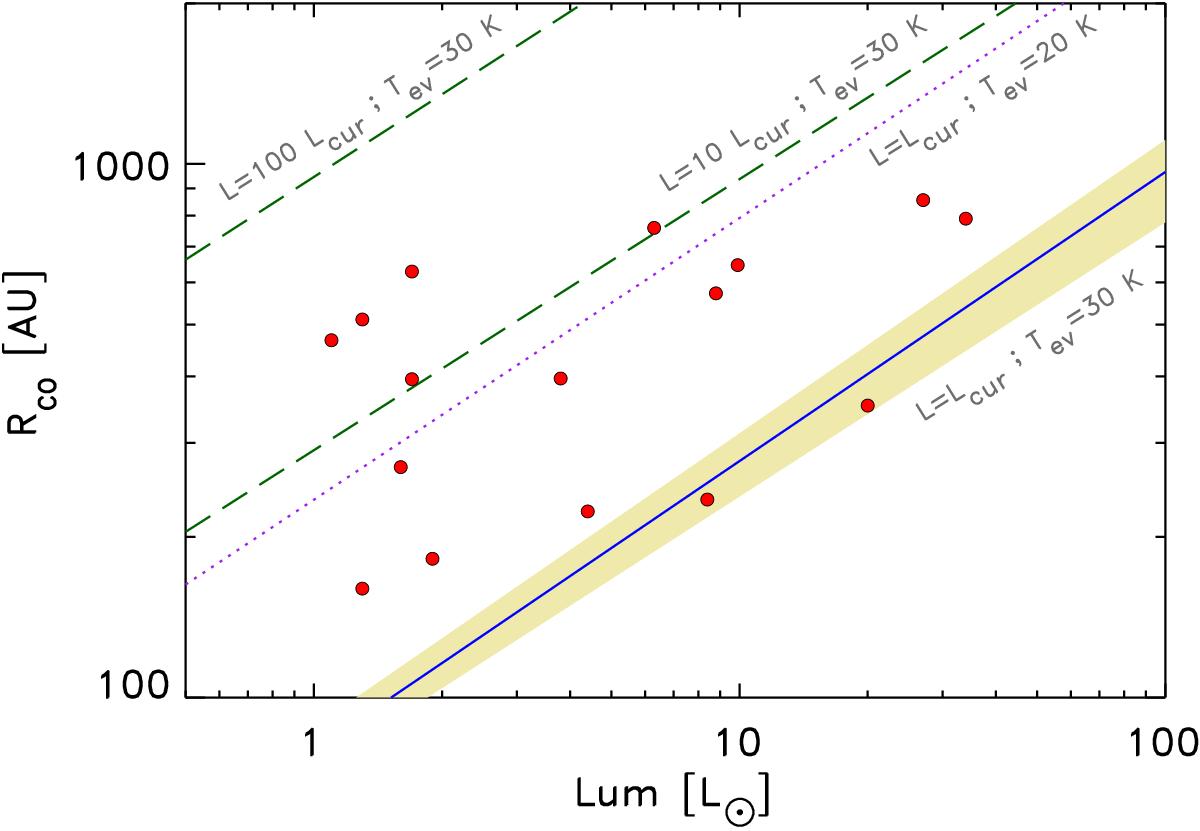
Radii of C18O emission at the half-maximum intensity for the 16 Class 0 protostellar sources studied in this paper (symbols) as a function of luminosity compared to the predictions from radiative transfer models: the solid line indicates a 1 M⊙ envelope with sublimation of CO and resulting increase in abundance by two orders of magnitude within the radius where the temperature increases above 30 K. The shaded area corresponds to envelope masses ranging from 0.3−3 M⊙. The dotted line represents models where the sublimation takes place at a temperature of 20 K. Finally, the dashed lines correspond to sources where the luminosity has been increased by one and two orders of magnitude and the sublimation takes place for a temperature of 30 K. The typical uncertainties on the measured extents are 10–20% of the plotted values; the typical uncertainties in the predicted extents are up to 50% owing to the uncertainties in the underlying model, luminosity, etc.
Current usage metrics show cumulative count of Article Views (full-text article views including HTML views, PDF and ePub downloads, according to the available data) and Abstracts Views on Vision4Press platform.
Data correspond to usage on the plateform after 2015. The current usage metrics is available 48-96 hours after online publication and is updated daily on week days.
Initial download of the metrics may take a while.