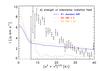
Fig. 3
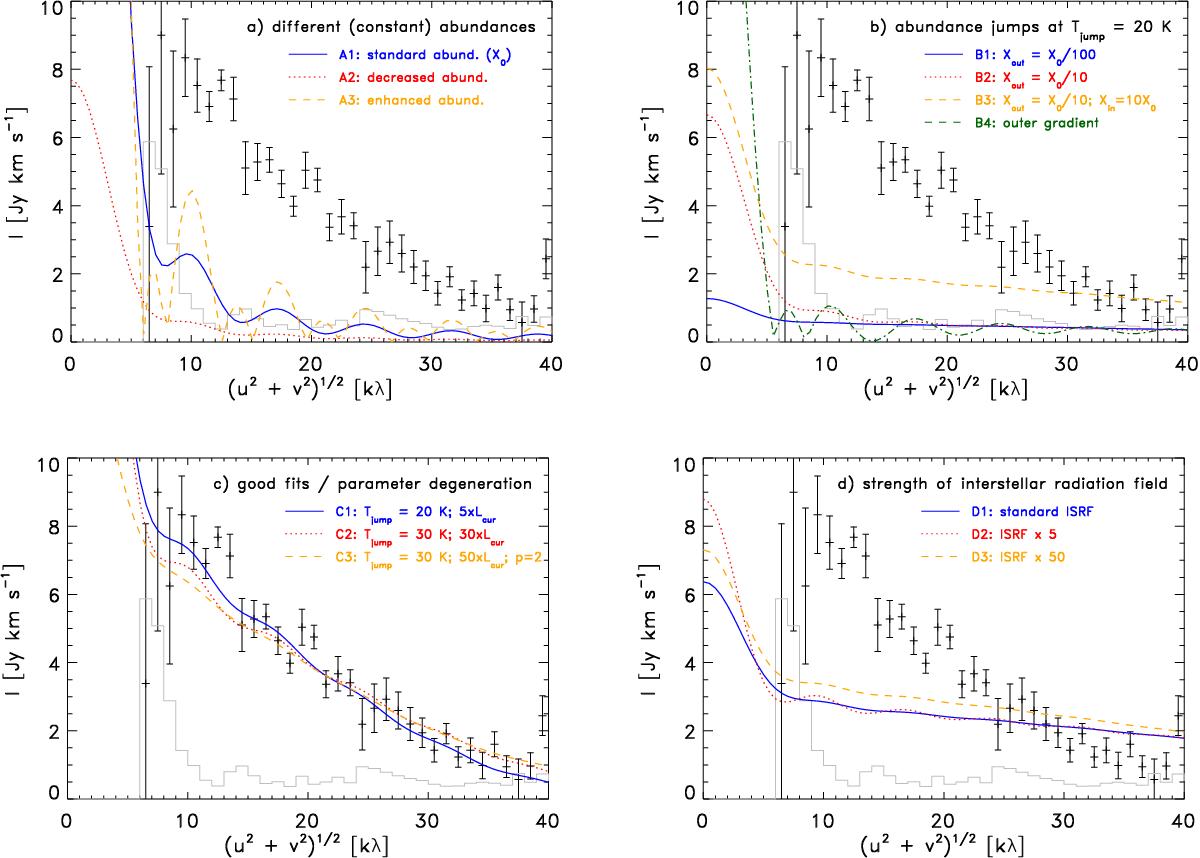
Comparison between different parameterizations of the envelope physical and chemical structure (for details of the parameters for each model, see Table 2) comparing the observed and modeled visibility amplitude as function of projected baseline length for IRAS 03282. In each panel the observed integrated C18O emission is seen as datapoints with models as lines. The gray histogram indicates the expected amplitude for zero signal. In panel a) models with constant abundances and a luminosity corresponding to the current source luminosity (1.1 L⊙). In panel b) models with a changing abundance at the radius where the temperature increases above 20 K. In panel c) the source luminosity is increased and CO consequently sublimates at larger radii providing the variation in intensity as function of projected baselines required to fit the data. Finally panel d) tests the importance of varying the strength of the external interstellar radiation field – which again is found to only affect the outer parts of the envelopes.
Current usage metrics show cumulative count of Article Views (full-text article views including HTML views, PDF and ePub downloads, according to the available data) and Abstracts Views on Vision4Press platform.
Data correspond to usage on the plateform after 2015. The current usage metrics is available 48-96 hours after online publication and is updated daily on week days.
Initial download of the metrics may take a while.