Fig. 2
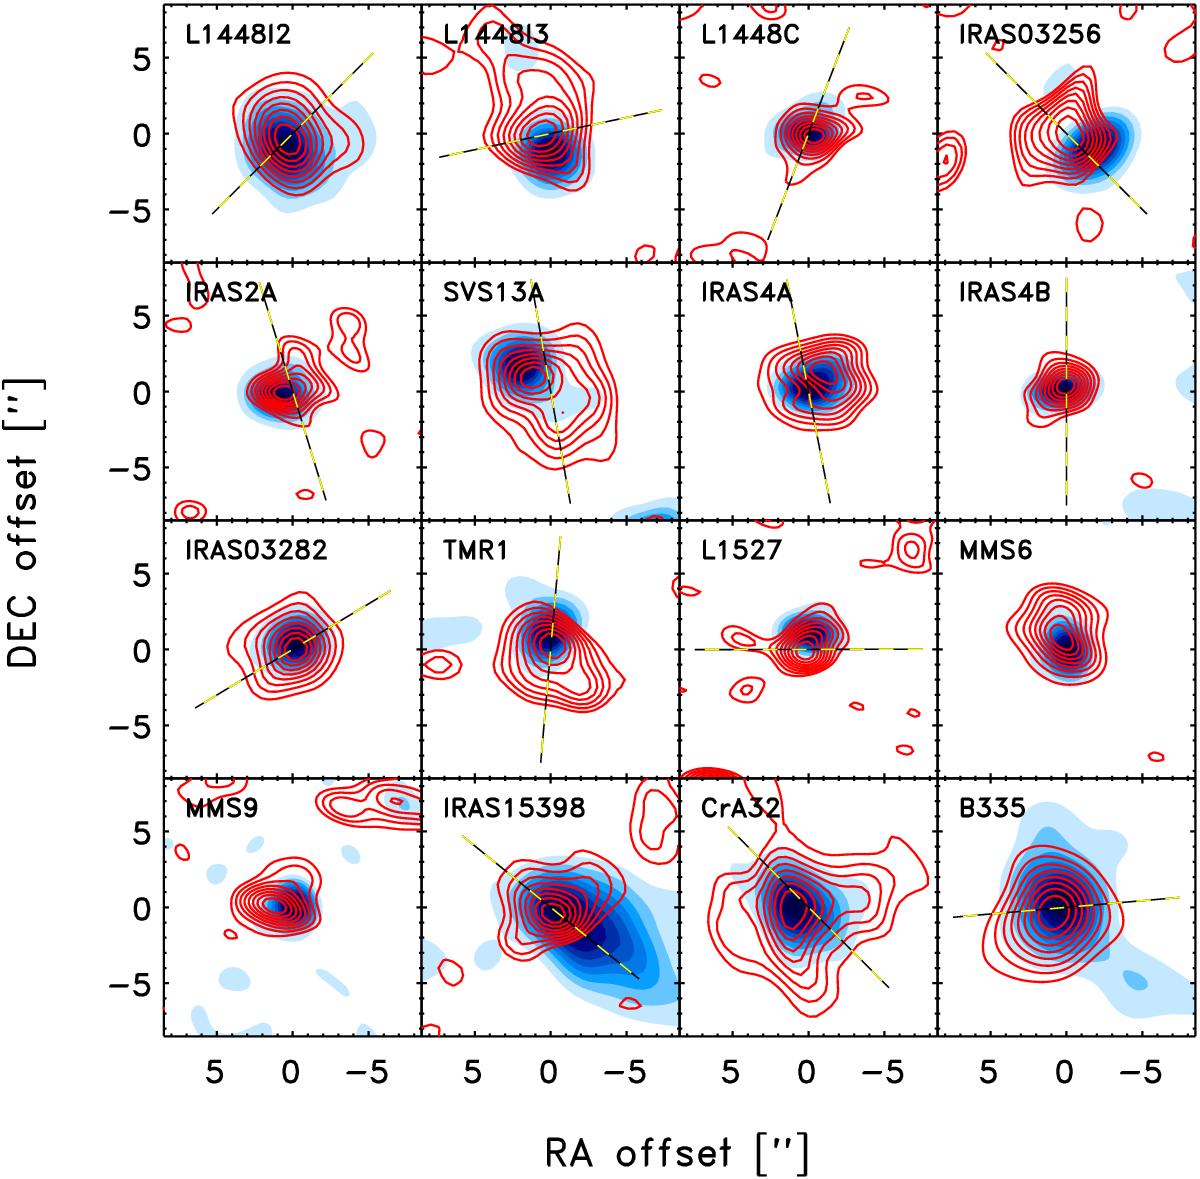
Integrated C18O 2–1 emission for each of the protostars shown as contours on top of continuum maps of each source. The contours are shown at steps corresponding to 20%, 30%, 40%, etc., of the peak emission in the integrated line maps. The dashed lines indicate the outflow axis from SMA 12CO 2–1 maps for the sources where this line was observed simultaneously with C18O 2–1.
Current usage metrics show cumulative count of Article Views (full-text article views including HTML views, PDF and ePub downloads, according to the available data) and Abstracts Views on Vision4Press platform.
Data correspond to usage on the plateform after 2015. The current usage metrics is available 48-96 hours after online publication and is updated daily on week days.
Initial download of the metrics may take a while.