Fig. 10
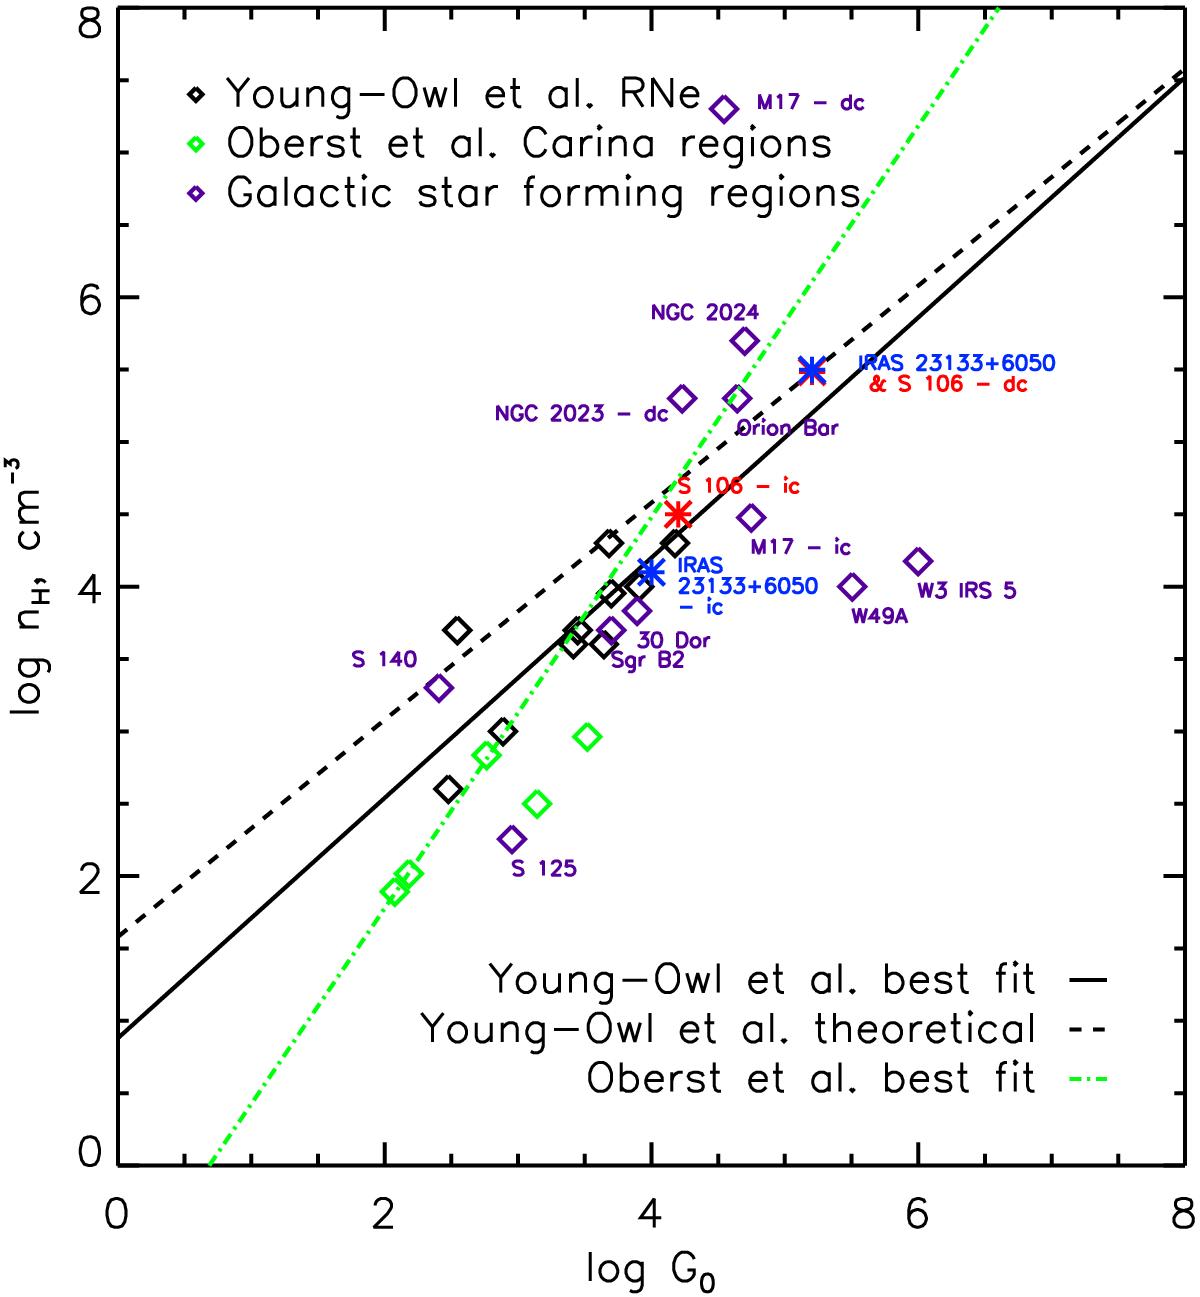
Correlations between G0 and density n0 found by Young Owl et al. (2002) and Oberst et al. (2011). Reflection nebula points from Young Owl et al. (2002), Galactic PDRs as stated in Table 9. IRAS 23133+6050 and S 106 fit into the trend between the larger H ii regions with hotter exciting stars and the RNe PDRs with B type exciting stars. Dashed and solid black lines: theoretical prediction for the relationship between radiation field and density for a pressure bound H ii region and the best fit to the Young Owl et al. (2002) data. Green dot-dashed line: best fit to the Carina nebula data of Oberst et al. (2011). For a selection of sources we have also included the points representing the dense PDR component (denoted “dc”) as opposed to the default values representing the interclump medium (denoted “ic”).
Current usage metrics show cumulative count of Article Views (full-text article views including HTML views, PDF and ePub downloads, according to the available data) and Abstracts Views on Vision4Press platform.
Data correspond to usage on the plateform after 2015. The current usage metrics is available 48-96 hours after online publication and is updated daily on week days.
Initial download of the metrics may take a while.