Fig. 1
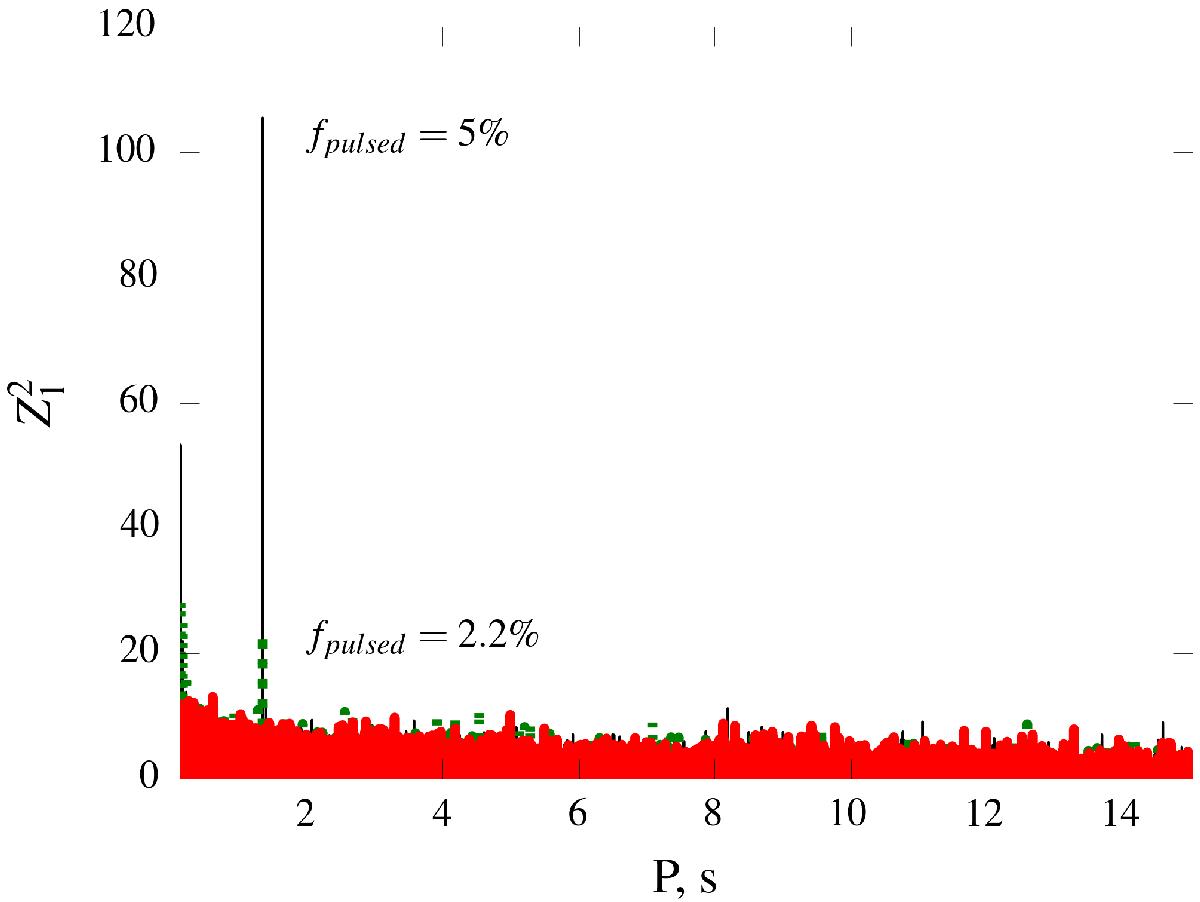
Periodogram for the longest observation of the pulsating in ULX in M82 (thick red line, obsid 0206080101, exposure of 46 ks), and periodograms for simulated sinusoidal signal with pulsed fractions of 5% (thin black line, only visible at the peak) and 2.2% (dotted green line) with the same exposure, observation duration, and total number of photons as observed.
Current usage metrics show cumulative count of Article Views (full-text article views including HTML views, PDF and ePub downloads, according to the available data) and Abstracts Views on Vision4Press platform.
Data correspond to usage on the plateform after 2015. The current usage metrics is available 48-96 hours after online publication and is updated daily on week days.
Initial download of the metrics may take a while.