Fig. 9
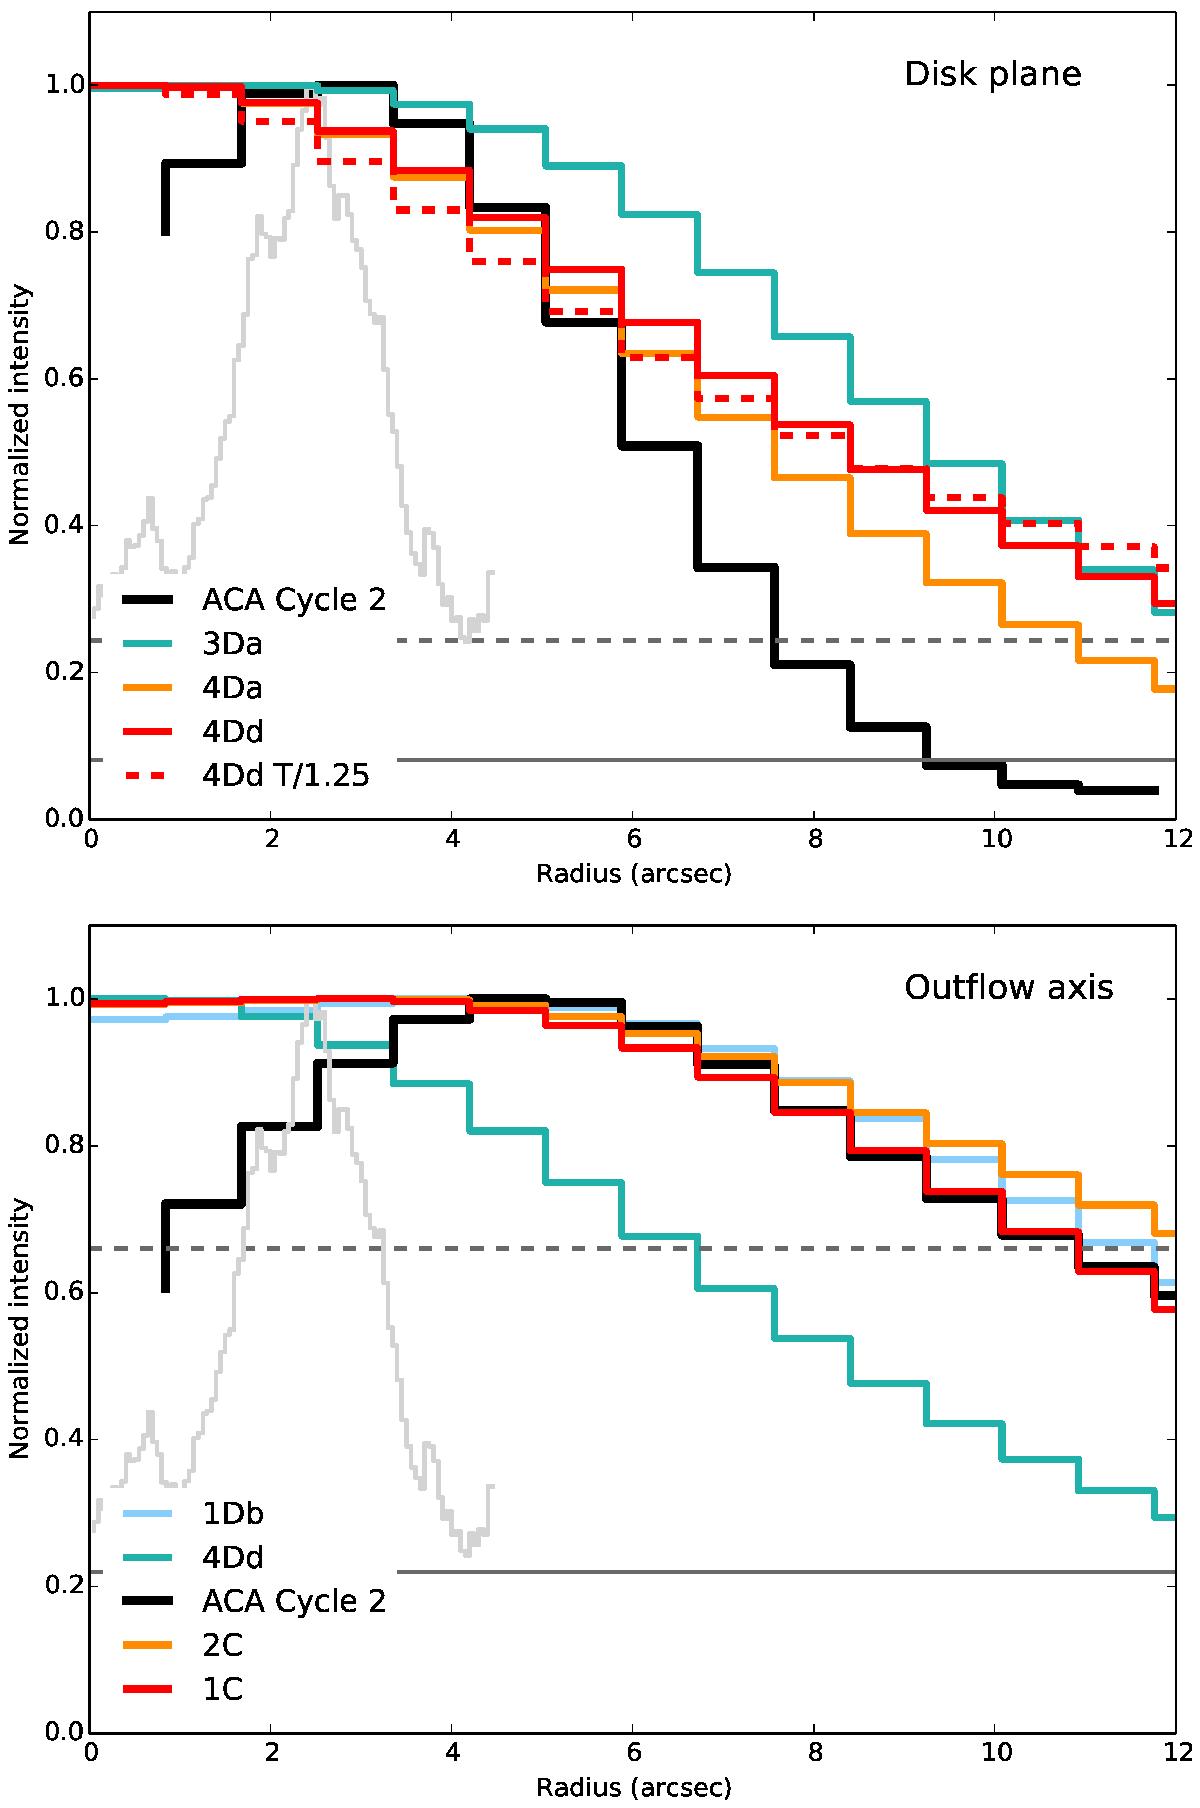
Radial profiles of the DCO+ ACA observations along the disk plane (top) and along the outflow axis perpendicular to the disk (bottom) as shown in Fig. 2. Radial profile of the DCO+ Cycle 0 observations is shown in light gray. Observed radial profiles are overlaid with models convolved to the resolution of the ACA observations. Gray solid and dashed lines show the 1σ and 3σ levels, respectively, of the ACA emission. These results evidence that the DCO+ emission along the disk plane is best approximated by model 4Dd, whereas along the outflow is best described by model 1C.
Current usage metrics show cumulative count of Article Views (full-text article views including HTML views, PDF and ePub downloads, according to the available data) and Abstracts Views on Vision4Press platform.
Data correspond to usage on the plateform after 2015. The current usage metrics is available 48-96 hours after online publication and is updated daily on week days.
Initial download of the metrics may take a while.