Fig. 7
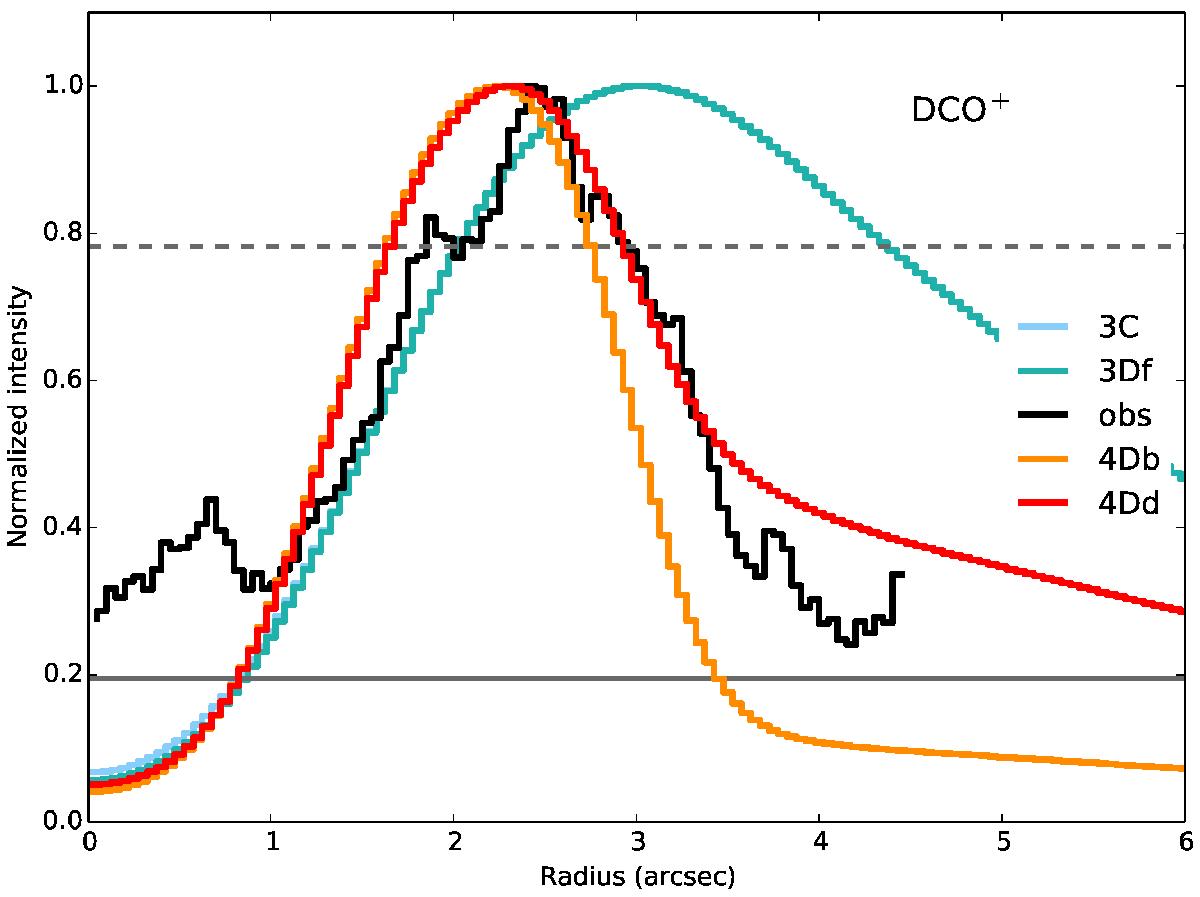
Comparison between observations and radiative transfer modeling of the chemical network results. Here the best approximations are highlighted, with model 4Dd being the preferred model. The models are referred to by test, abundance profile (Constant “C” or Drop “D”) and case. Thus, 4Dd is the model for test 4 with Drop abundance and case d. Black line shows the DCO+ observations integrated over the southern clump. Gray solid and dashed lines show the 1σ and 4σ levels, respectively.
Current usage metrics show cumulative count of Article Views (full-text article views including HTML views, PDF and ePub downloads, according to the available data) and Abstracts Views on Vision4Press platform.
Data correspond to usage on the plateform after 2015. The current usage metrics is available 48-96 hours after online publication and is updated daily on week days.
Initial download of the metrics may take a while.