Fig. 6
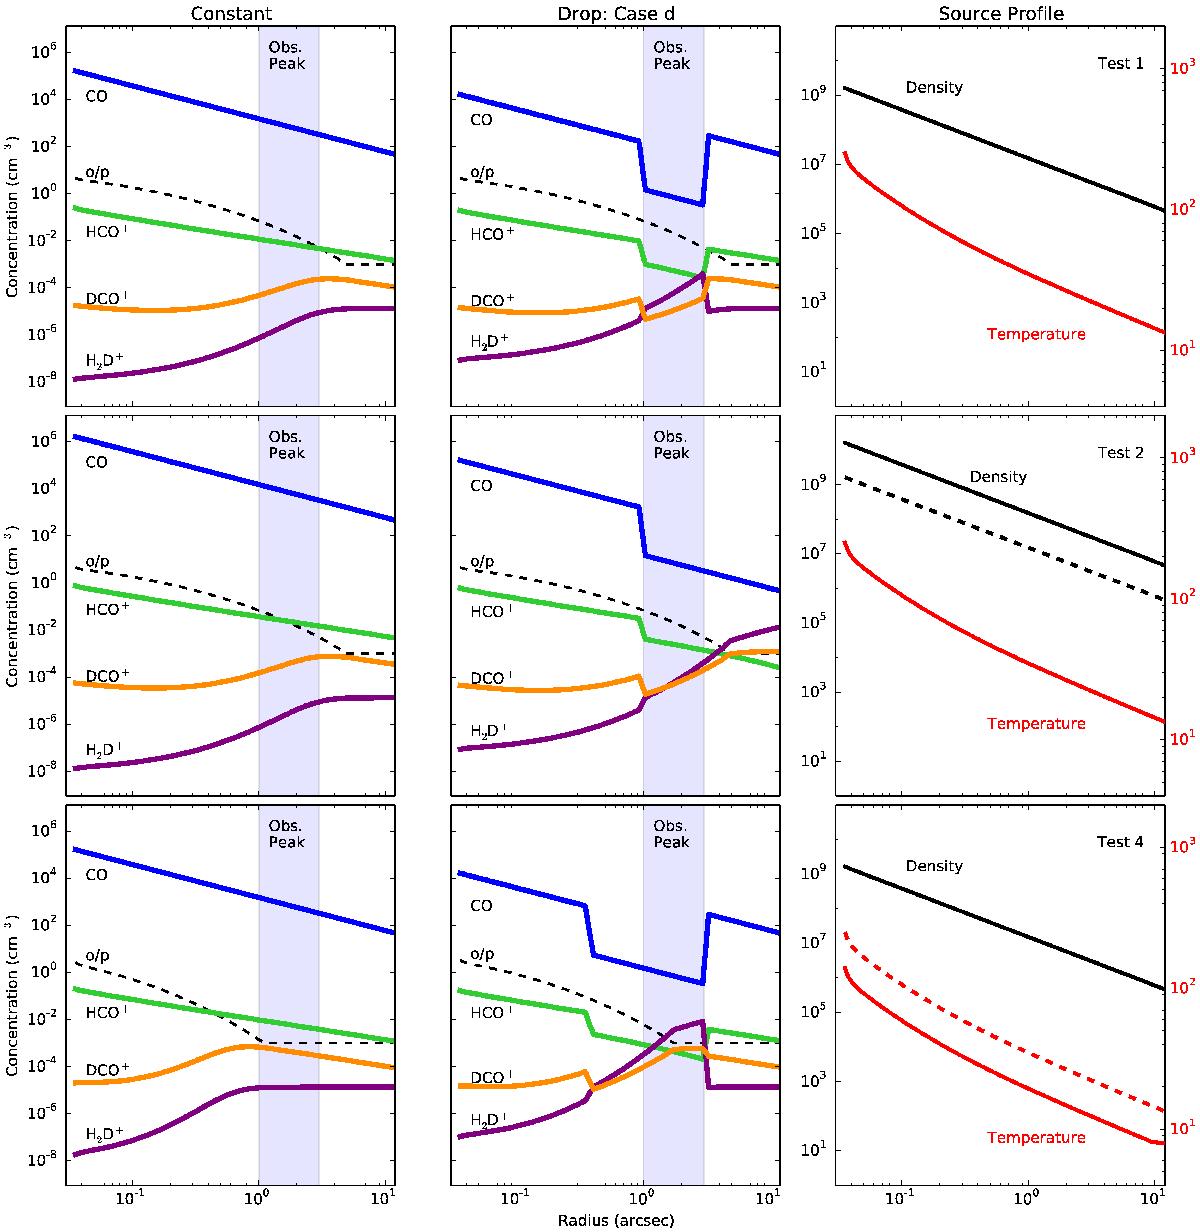
Chemical network model results. Left and center columns: results for constant and drop CO abundance, respectively. Top, middle and bottom row: results of Test 1, 2 and 4, respectively. Light blue shaded region shows the observed peak position of DCO+. Right column: input source profile, where the original DUSTY source profile is shown with a dashed line so as to compare with the input for the specific test.
Current usage metrics show cumulative count of Article Views (full-text article views including HTML views, PDF and ePub downloads, according to the available data) and Abstracts Views on Vision4Press platform.
Data correspond to usage on the plateform after 2015. The current usage metrics is available 48-96 hours after online publication and is updated daily on week days.
Initial download of the metrics may take a while.