Free Access
Fig. 5
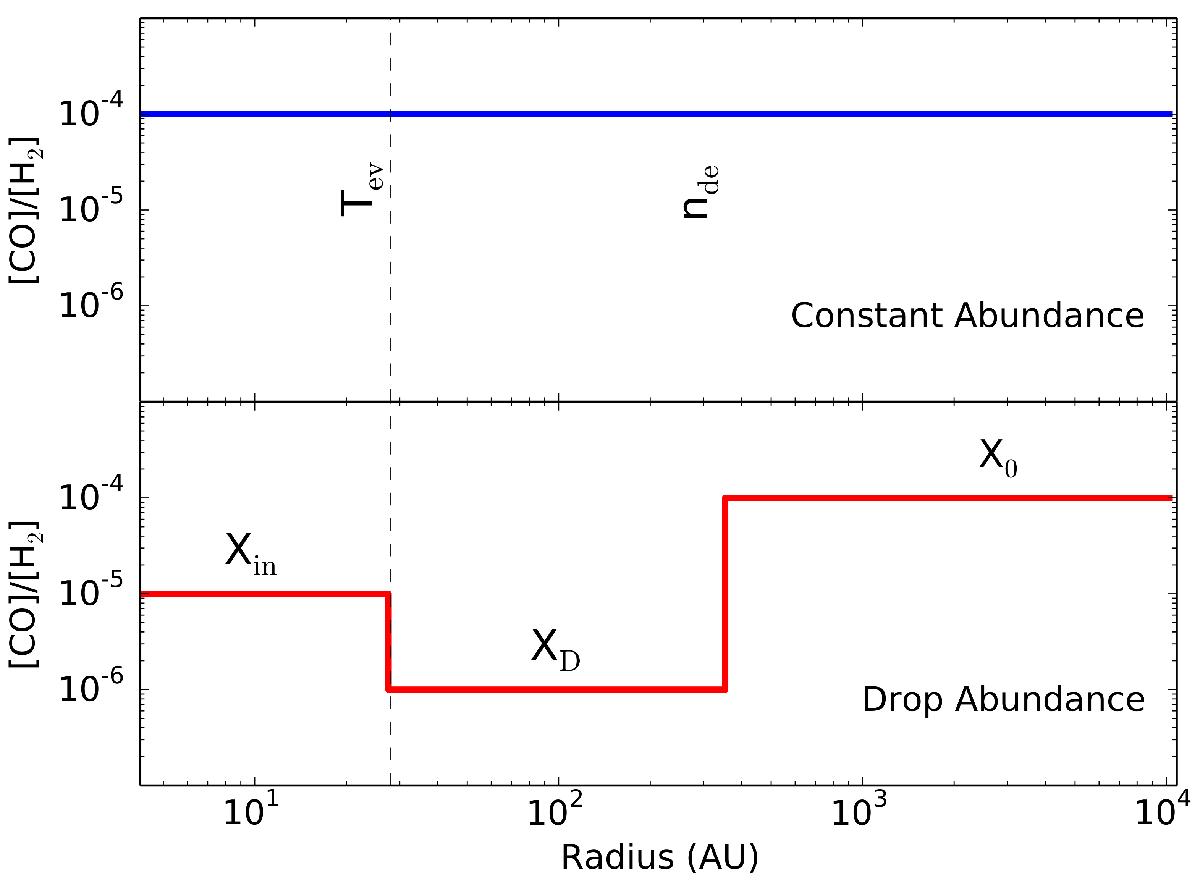
CO abundance profiles used in the model. The vertical dashed lines show the limits for the Drop abundance profile, evaporation temperature Tev and desorption density nde. X0 denotes the abundance in the constant profile. Xin, XD and X0 are the inner, drop and outer region abundances for the drop profile.
Current usage metrics show cumulative count of Article Views (full-text article views including HTML views, PDF and ePub downloads, according to the available data) and Abstracts Views on Vision4Press platform.
Data correspond to usage on the plateform after 2015. The current usage metrics is available 48-96 hours after online publication and is updated daily on week days.
Initial download of the metrics may take a while.