Free Access
Fig. 4
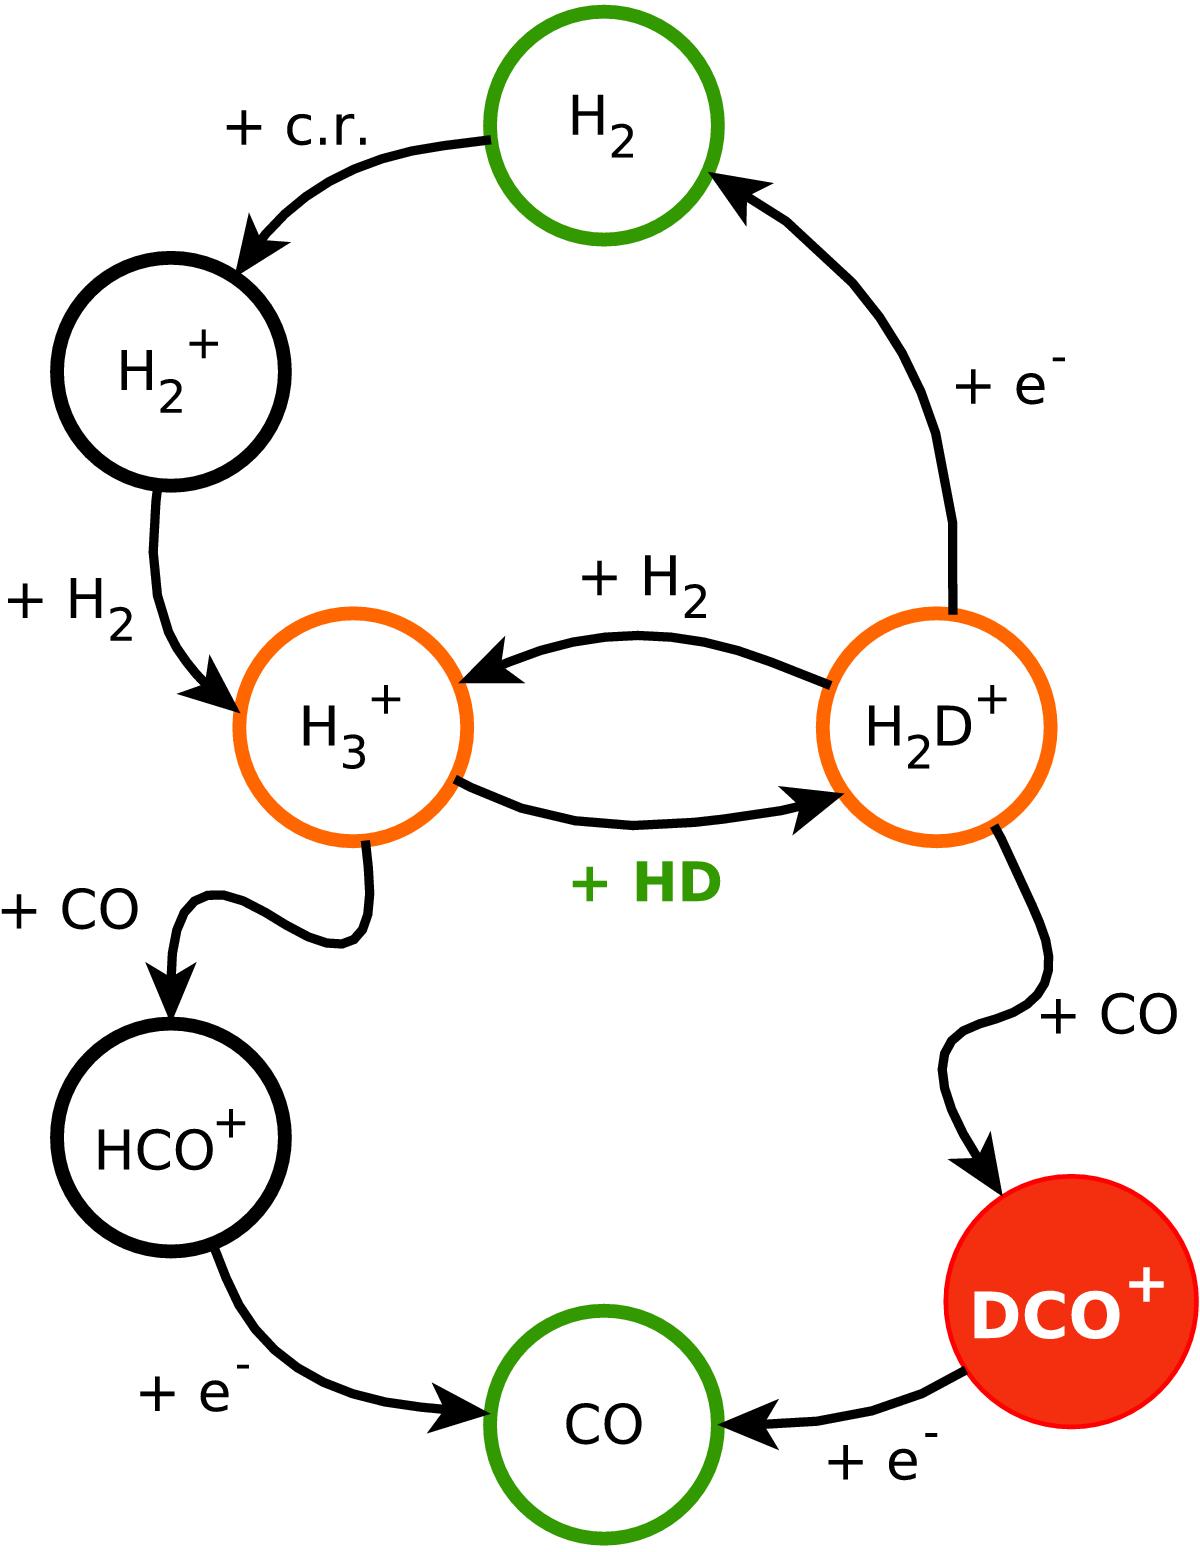
Cartoon of the chemical network used to analyze the observed DCO+ emission. Red denotes the target molecule. Green the input molecular concentrations and orange the species involved in the bottleneck reaction.
Current usage metrics show cumulative count of Article Views (full-text article views including HTML views, PDF and ePub downloads, according to the available data) and Abstracts Views on Vision4Press platform.
Data correspond to usage on the plateform after 2015. The current usage metrics is available 48-96 hours after online publication and is updated daily on week days.
Initial download of the metrics may take a while.