Fig. 3
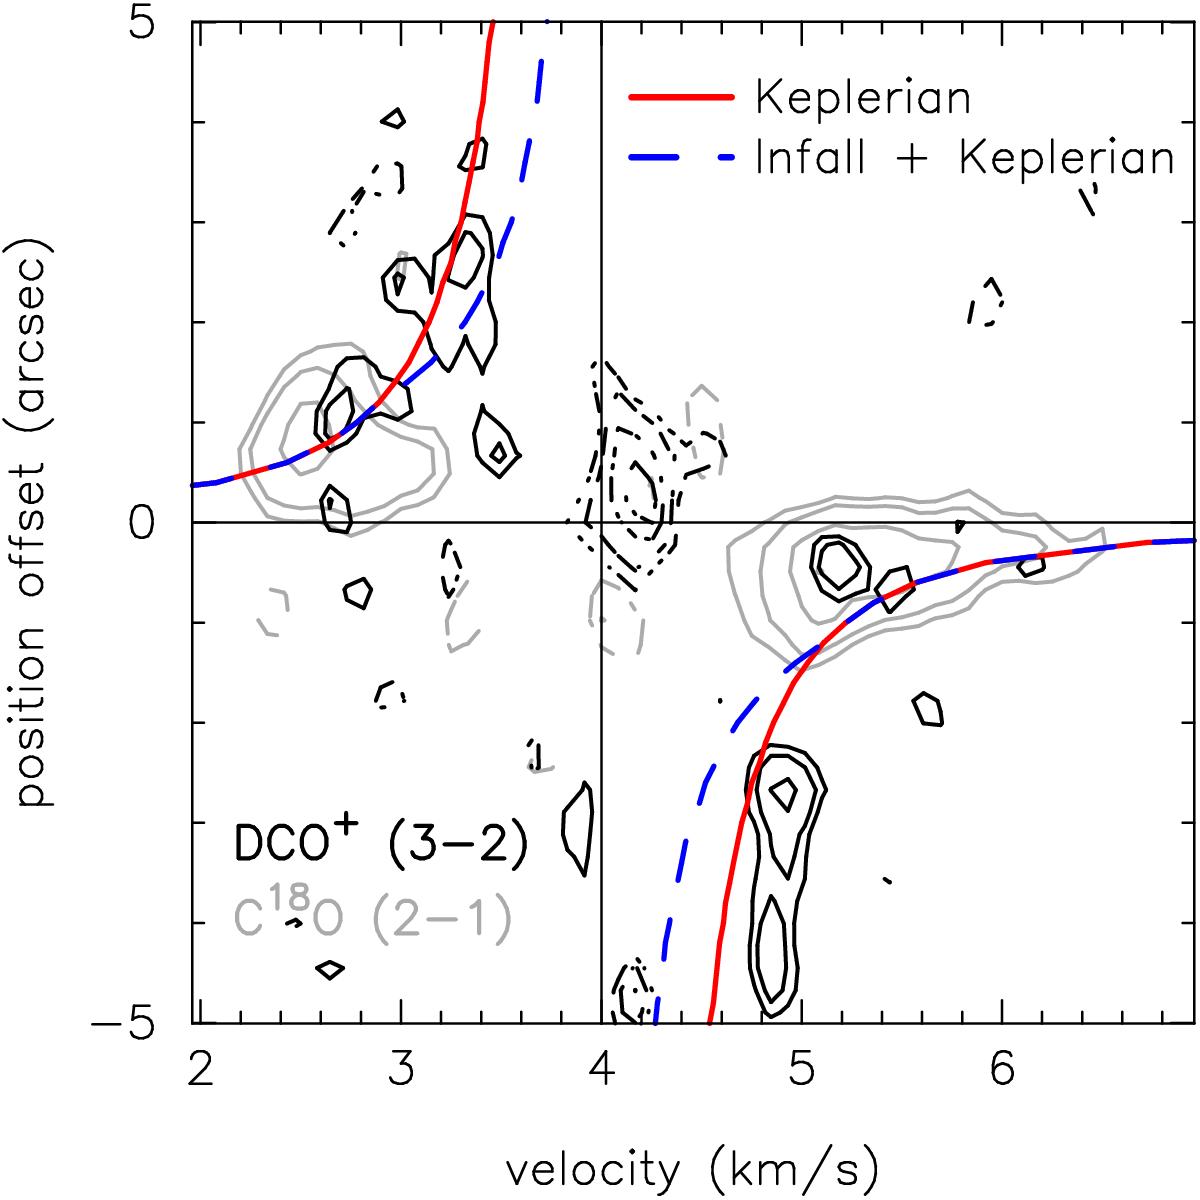
Cycle 0 DCO+ (black) and C18O (gray) PV diagram. Cuts are made at PA = 26° for DCO+ and PA = 35° for C18O. Keplerian (solid line) and Infall plus Keplerian (dashed line) rotation PV models with M∗ = 0.2 M⊙ are overplotted (Murillo et al. 2013). Contours are in steps of −3, 3, 5, 10 and 15σ with σ = 19 mJy beam-1 for C18O, −7, −5, −3, −2, 2, 3, 4, 5σ with σ = 12 mJy beam-1 for Cycle 0 DCO+.
Current usage metrics show cumulative count of Article Views (full-text article views including HTML views, PDF and ePub downloads, according to the available data) and Abstracts Views on Vision4Press platform.
Data correspond to usage on the plateform after 2015. The current usage metrics is available 48-96 hours after online publication and is updated daily on week days.
Initial download of the metrics may take a while.