Fig. 2
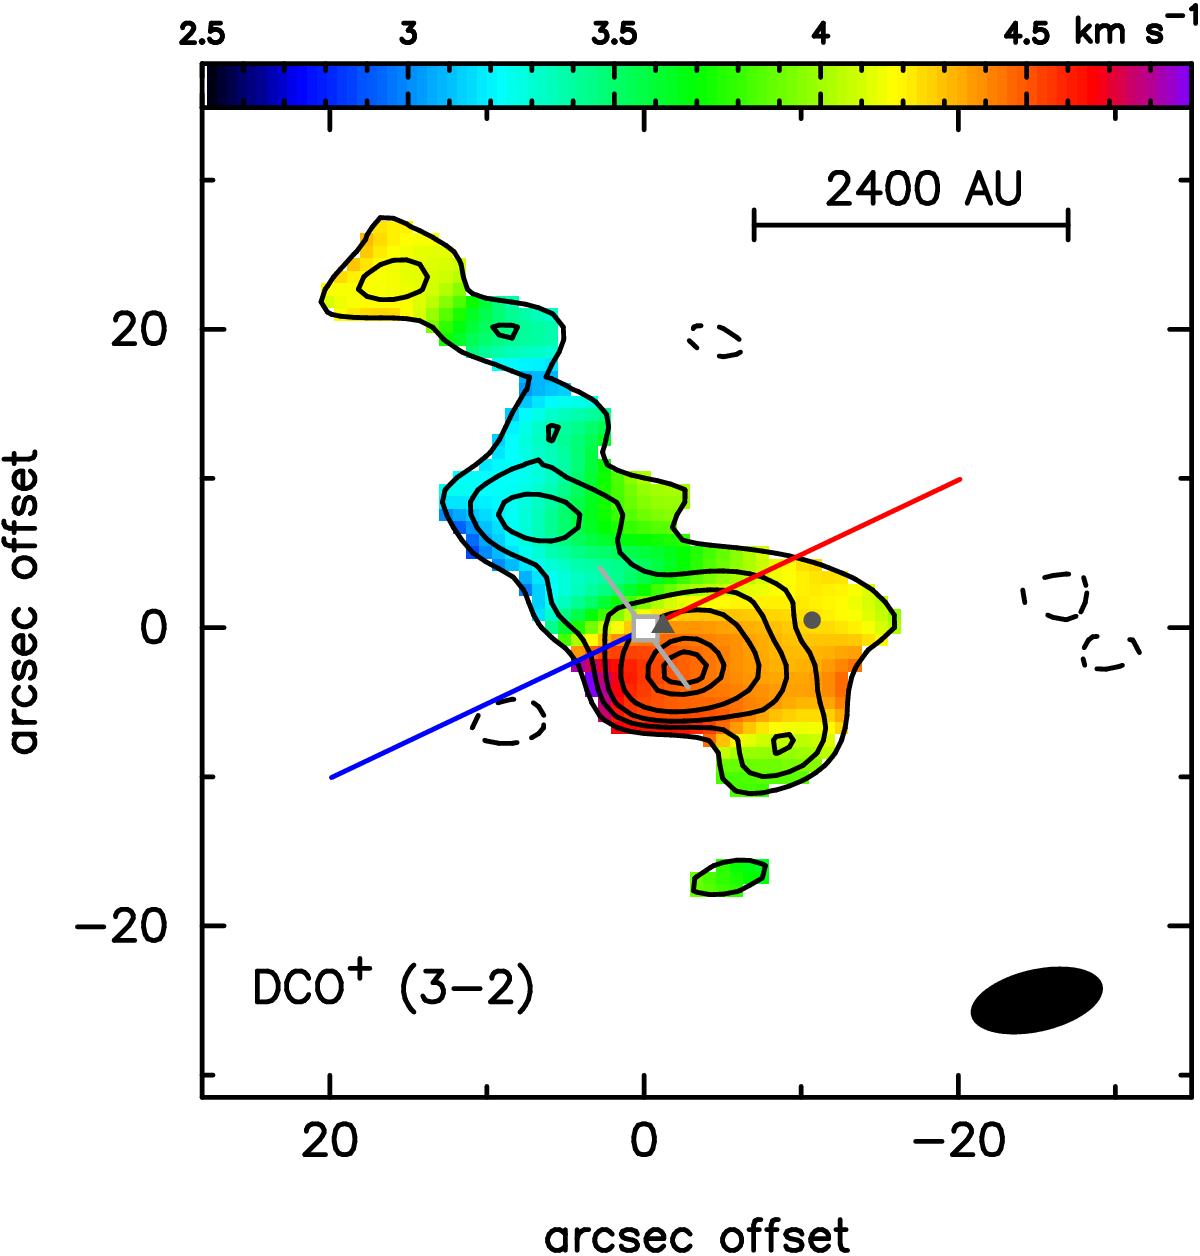
Intensity (contours) and velocity (color-scale) integrated maps of DCO+ ACA observations. Note the 10 times larger scale of this figure compared with Fig. 1. The positions of VLA1623A, B and W are marked with a square, triangle and circle, respectively. The size of the filled square shows the size of the C18O disk. The red and blue lines indicate the outflow direction while the gray line shows the mayor axis of the disk plane. The black ellipse shows the synthesized beam. Contours are in steps of −3, 3, 5, 7, 10, 15 and 17σ with σ = 220 mJy beam-1 km s-1.
Current usage metrics show cumulative count of Article Views (full-text article views including HTML views, PDF and ePub downloads, according to the available data) and Abstracts Views on Vision4Press platform.
Data correspond to usage on the plateform after 2015. The current usage metrics is available 48-96 hours after online publication and is updated daily on week days.
Initial download of the metrics may take a while.